
Century 21 People’s Choice Realty Inc., Brokerage
120 MATHESON BLVD E #103
MISSISSAUGA, Ontario
L4K 0A4
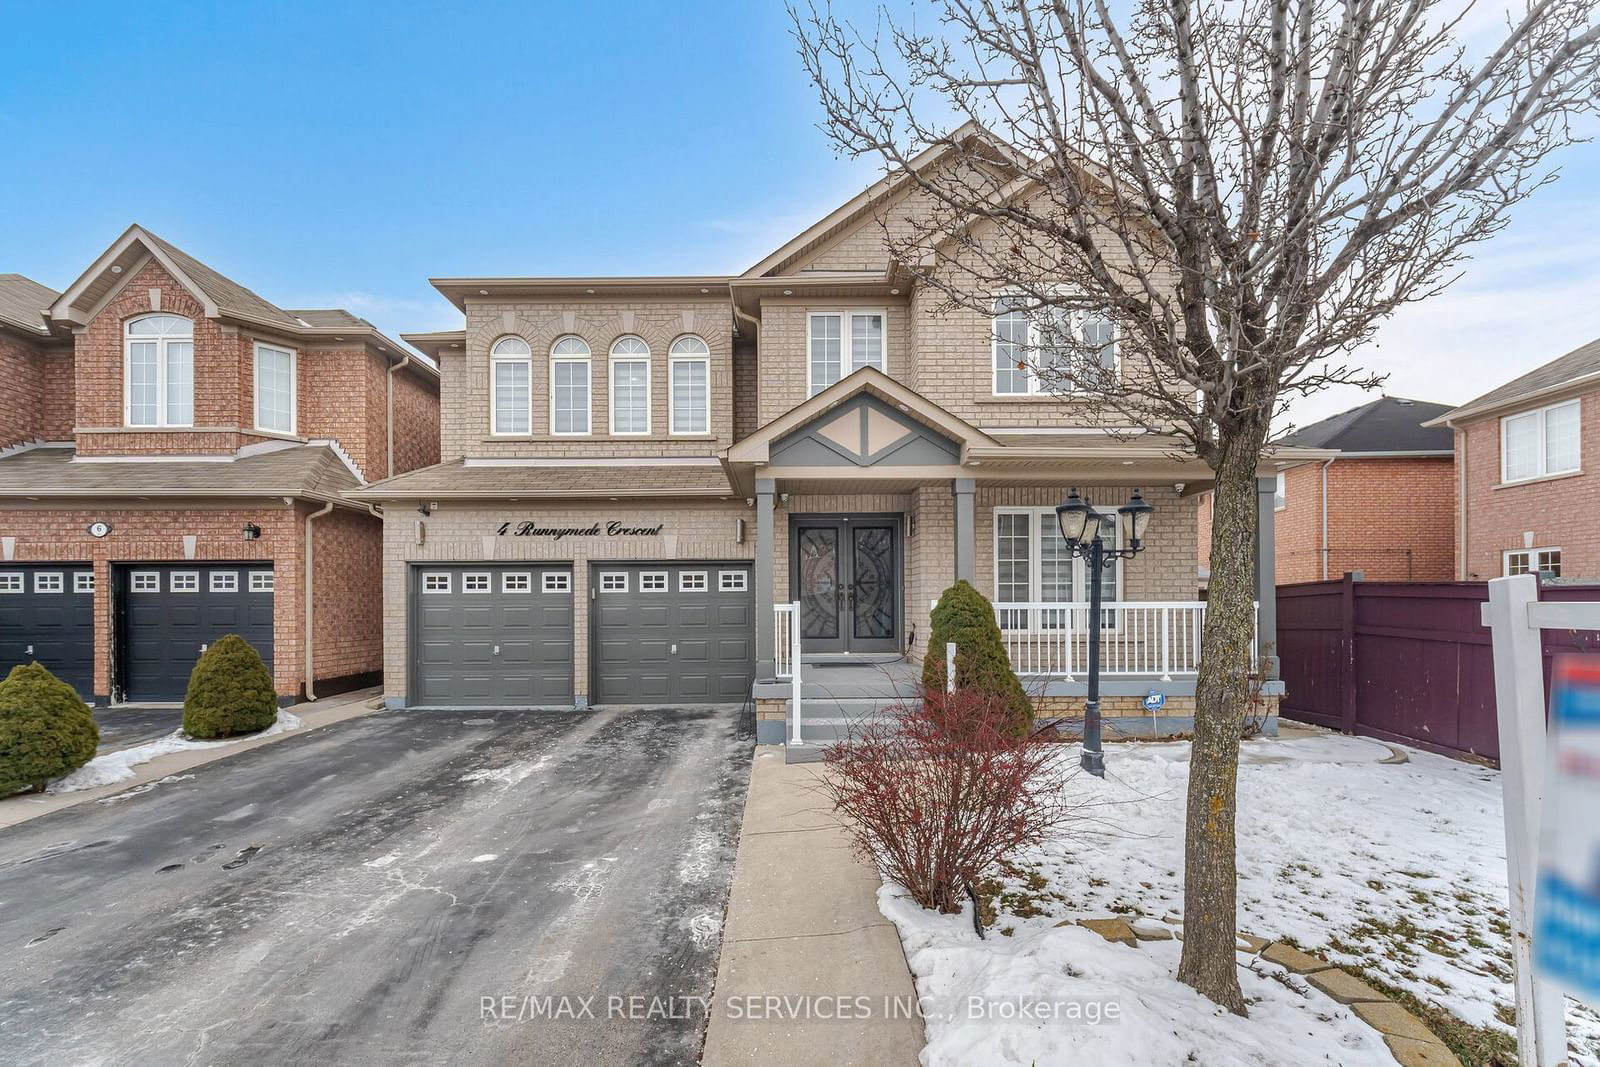


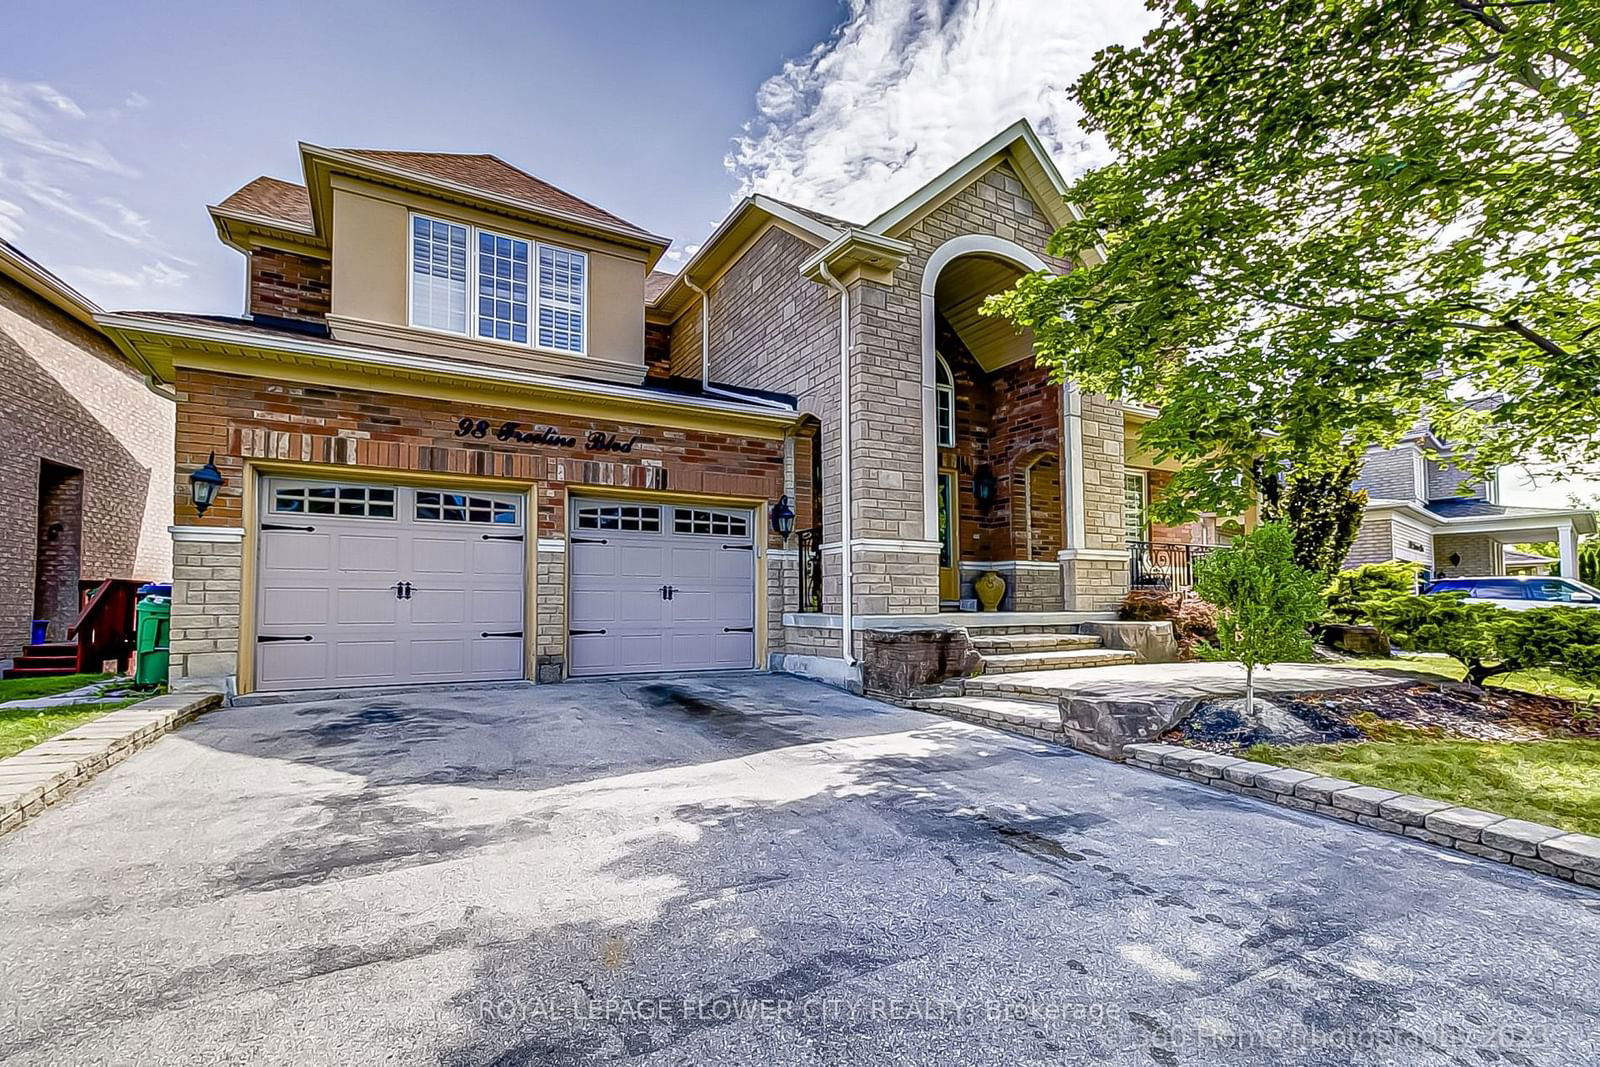
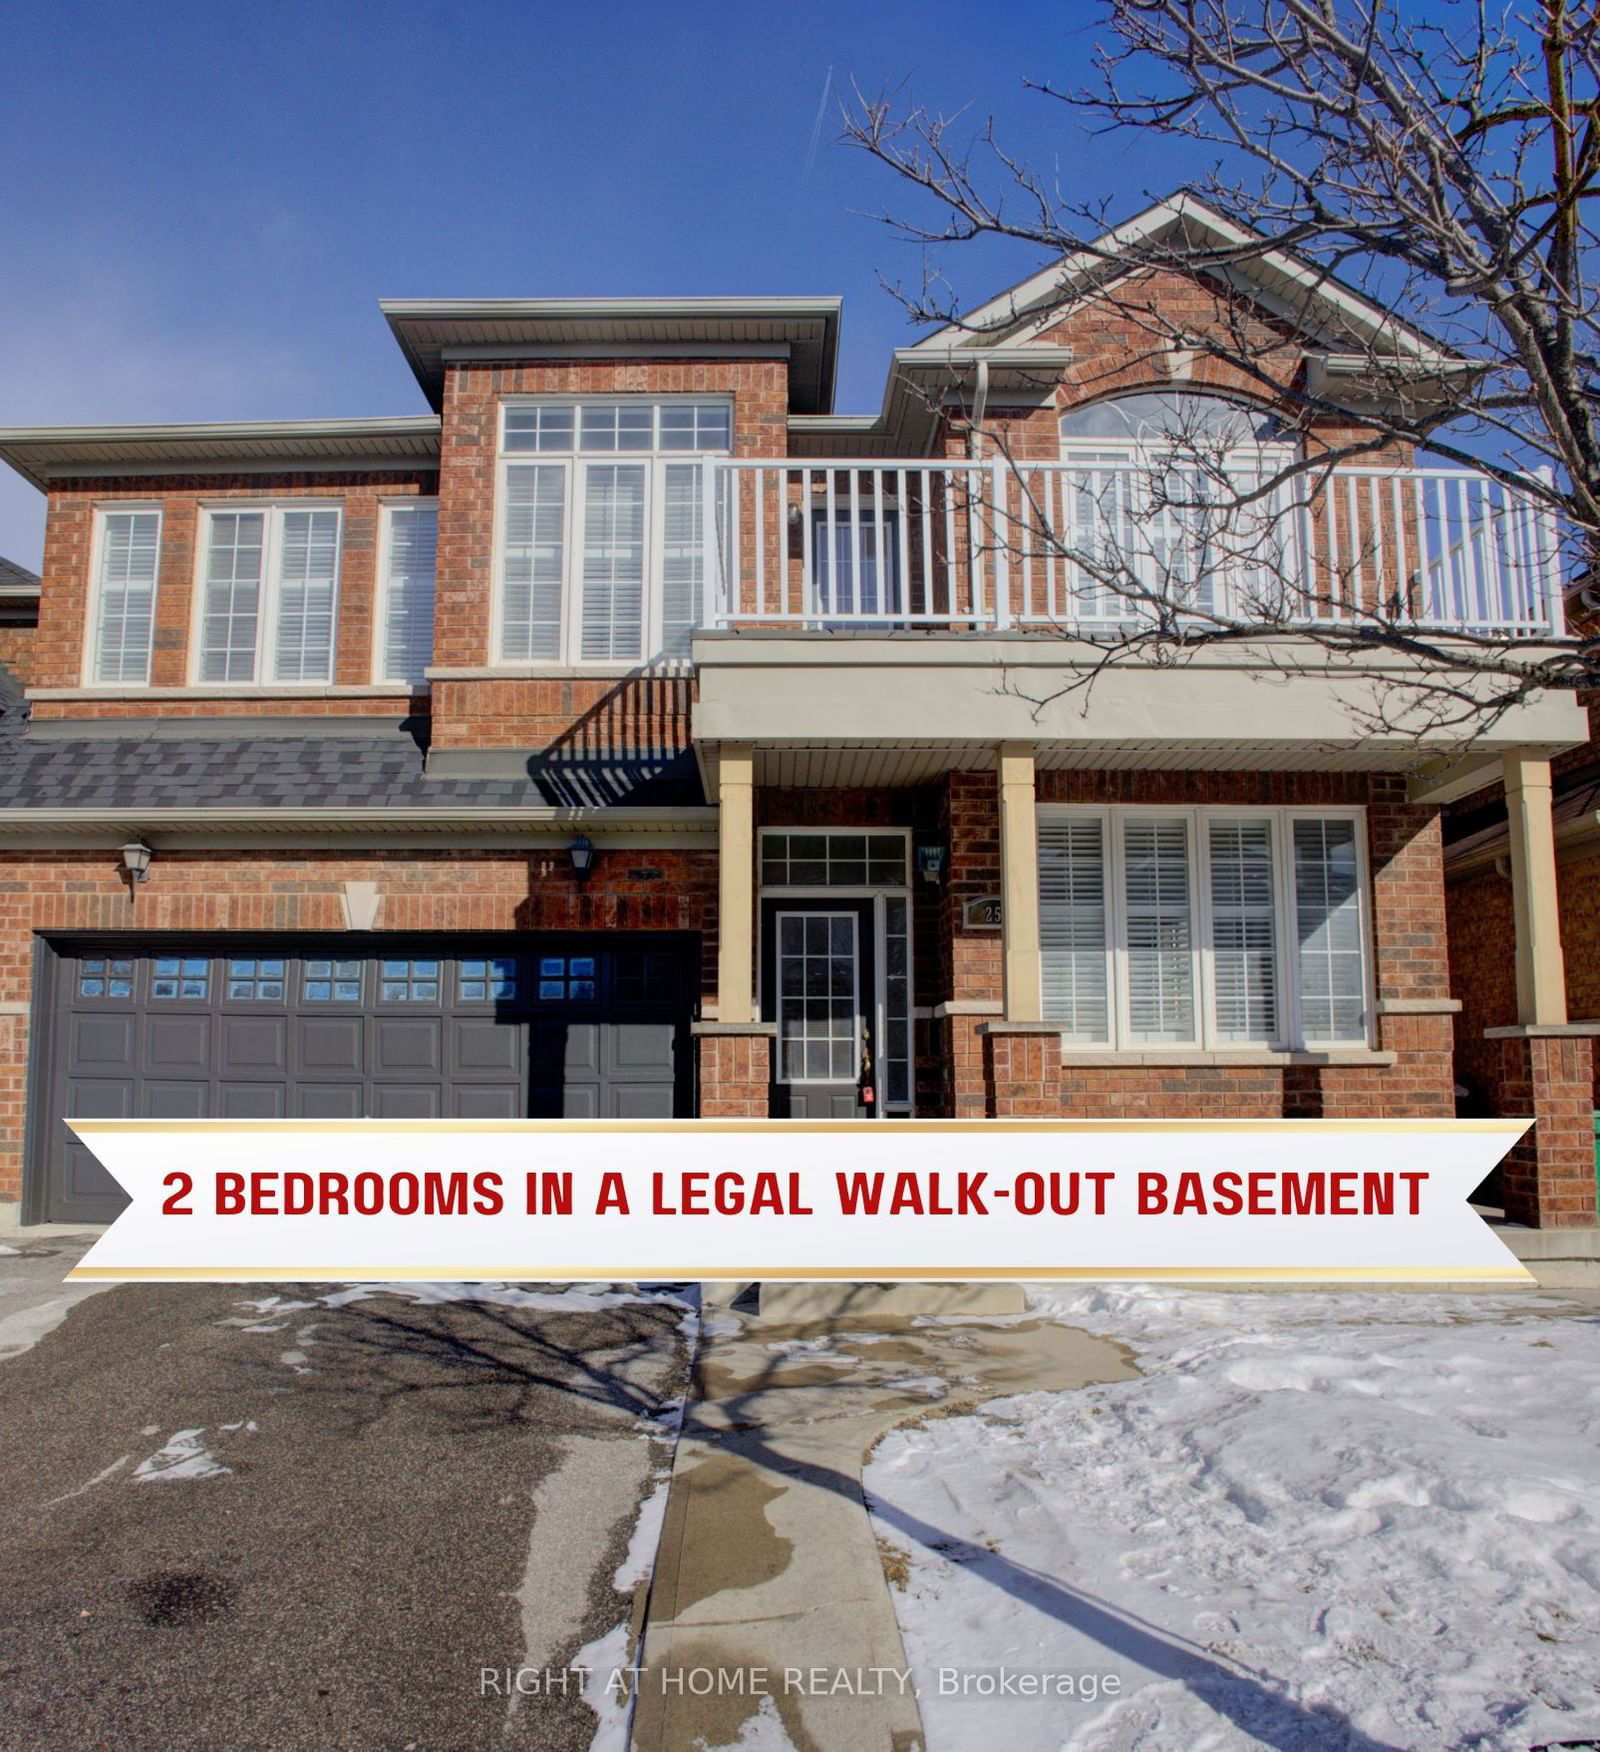
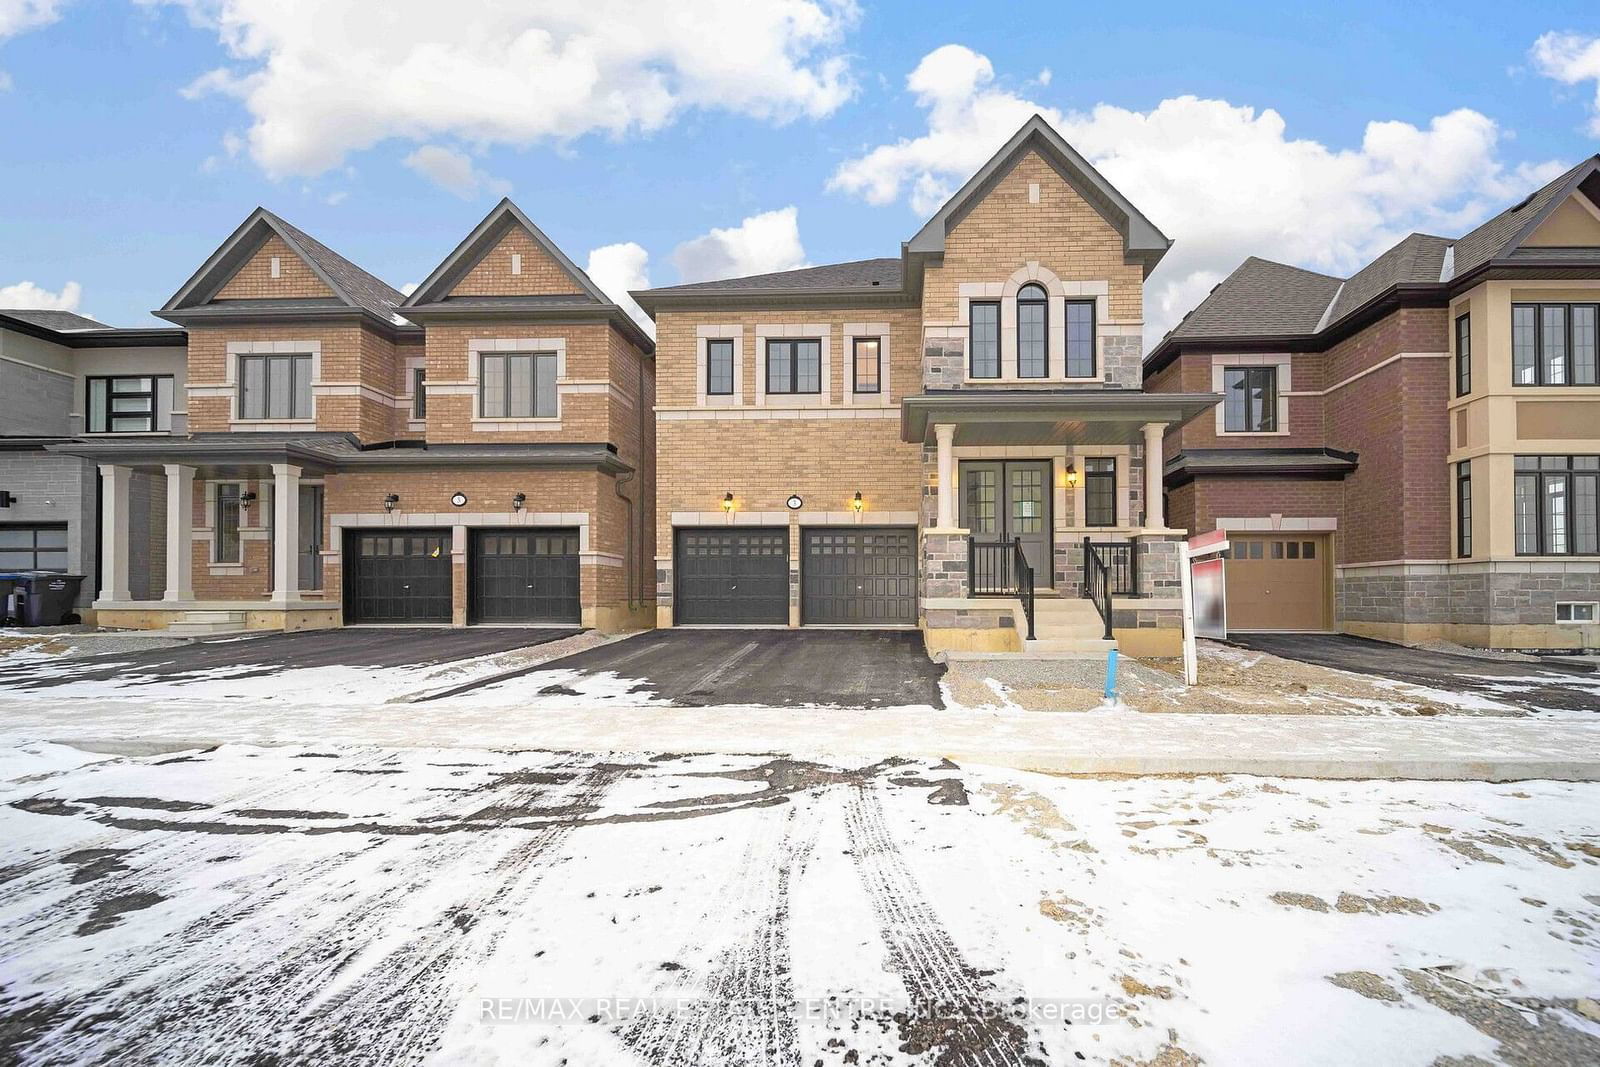
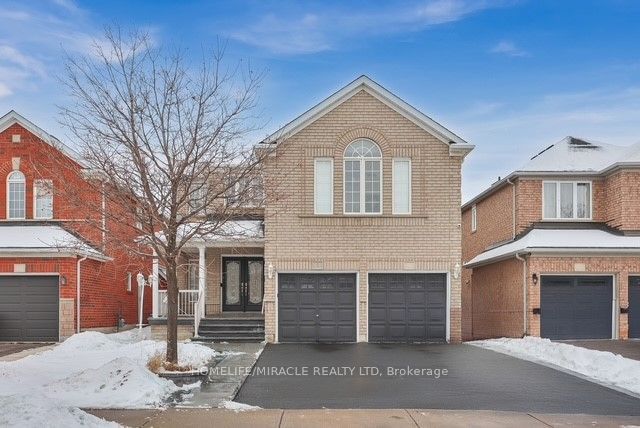
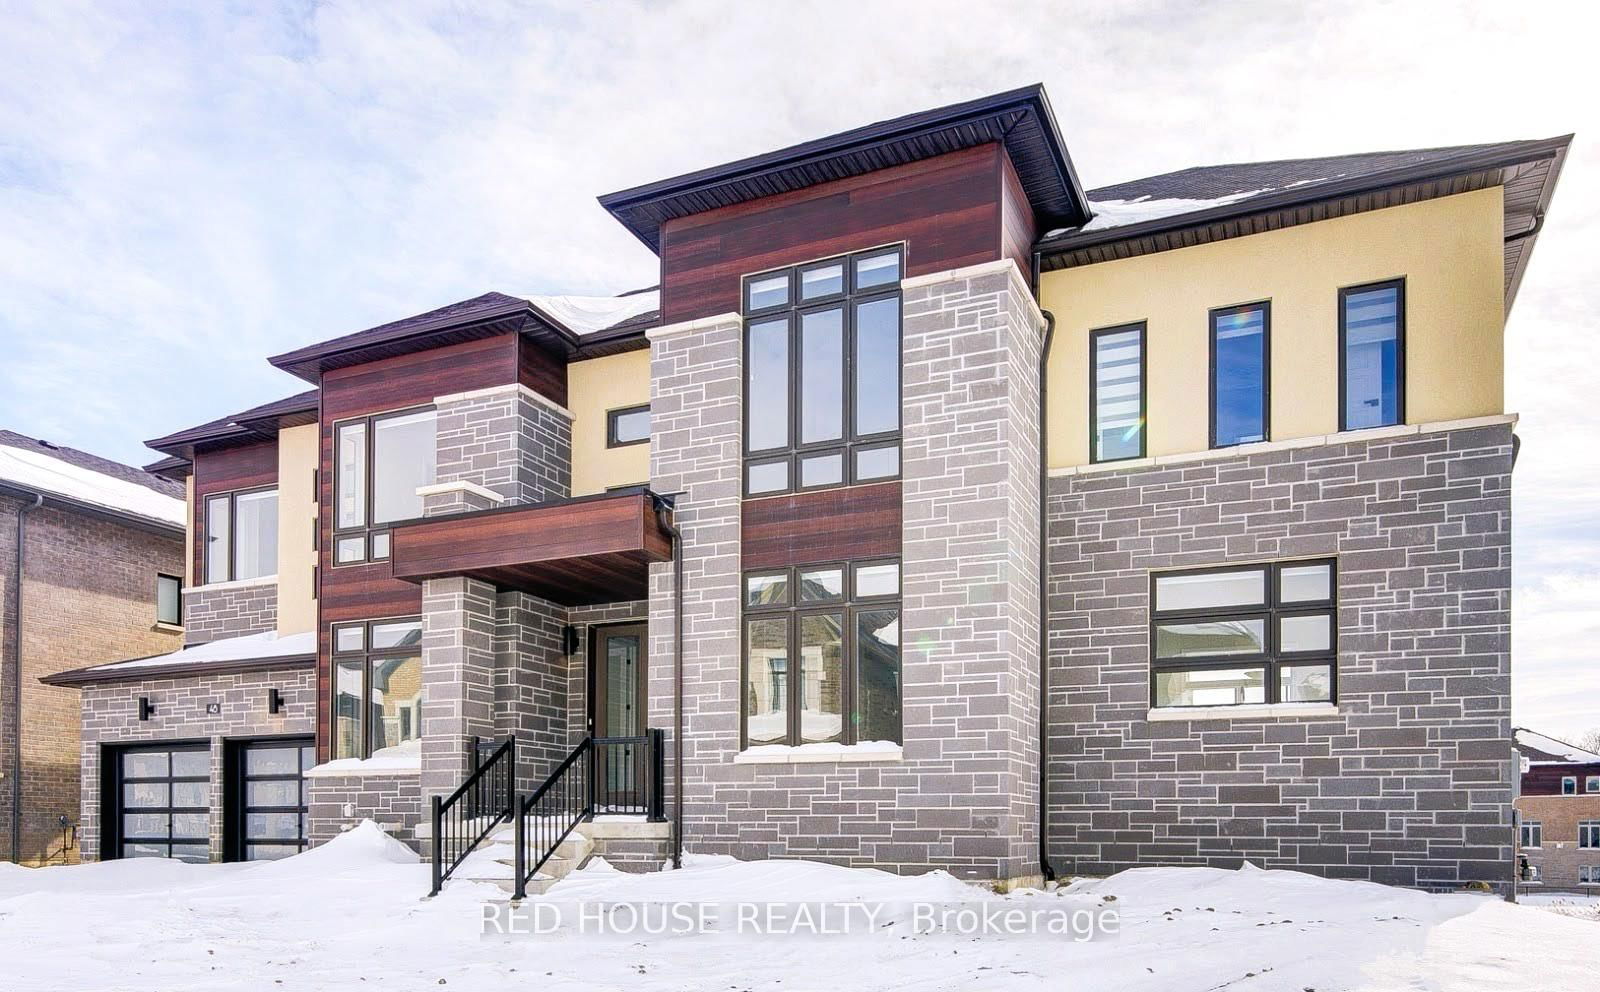
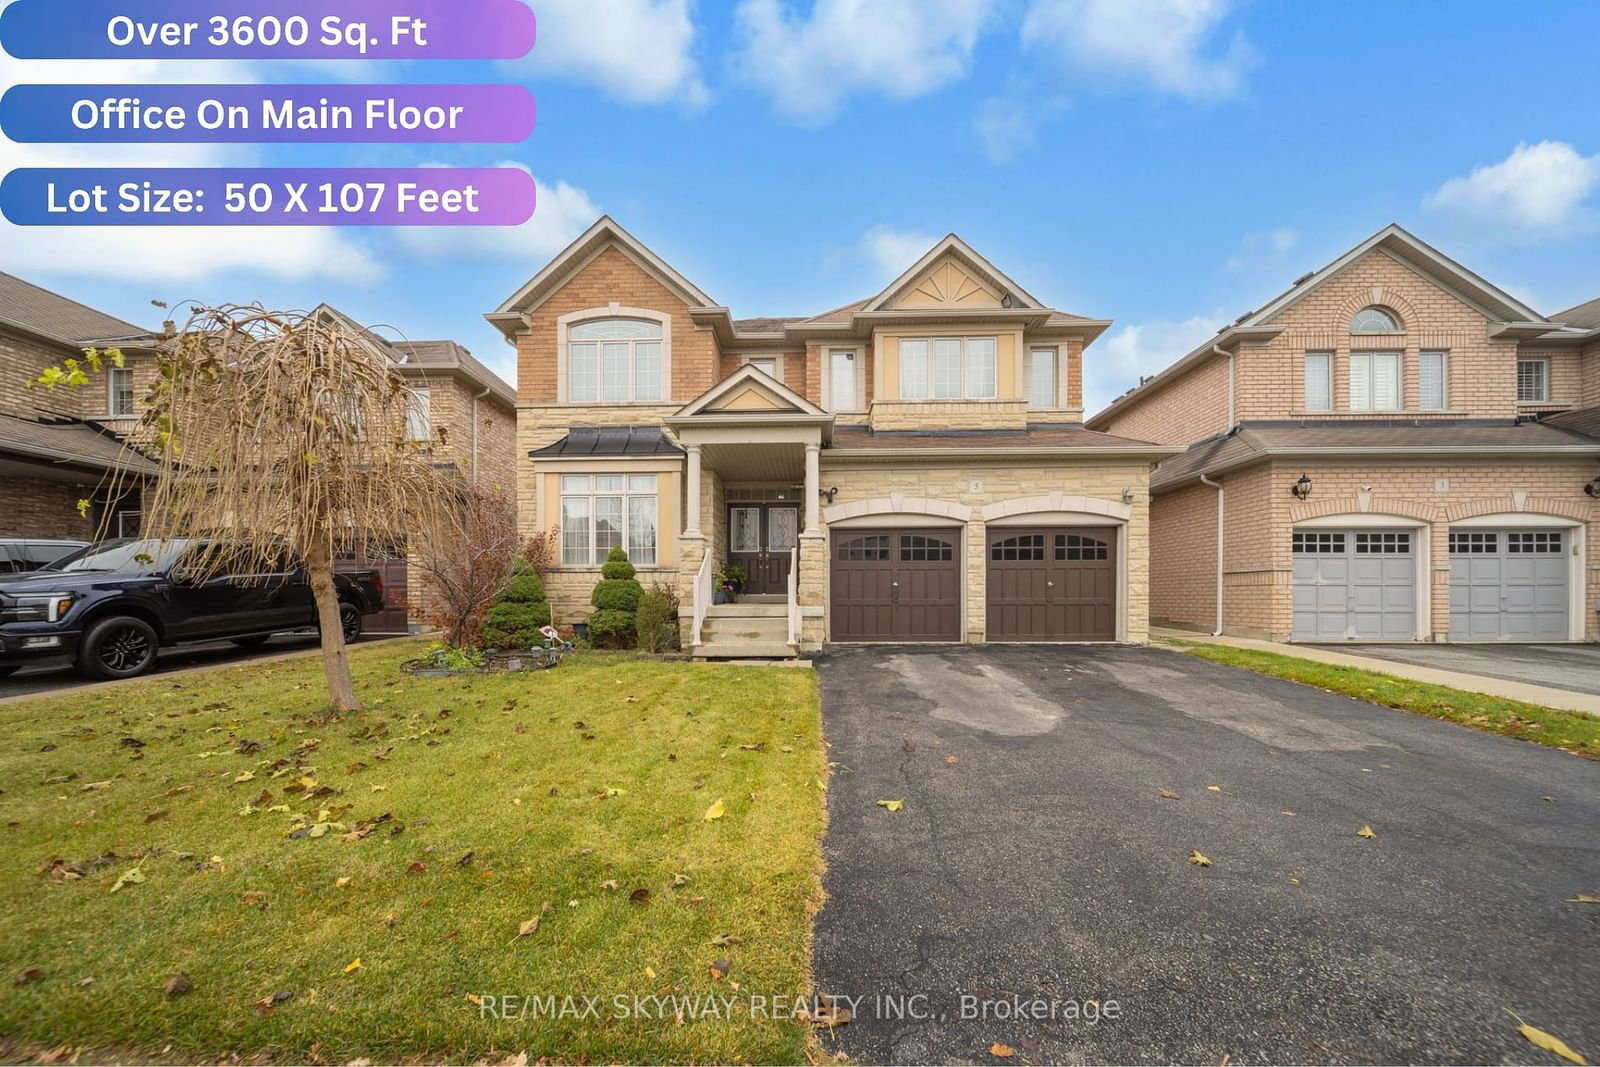
Brampton, Sandringham-Wellington, L6R 0L3
$1,599,900
Listed by RE/MAX REALTY SERVICES INC..
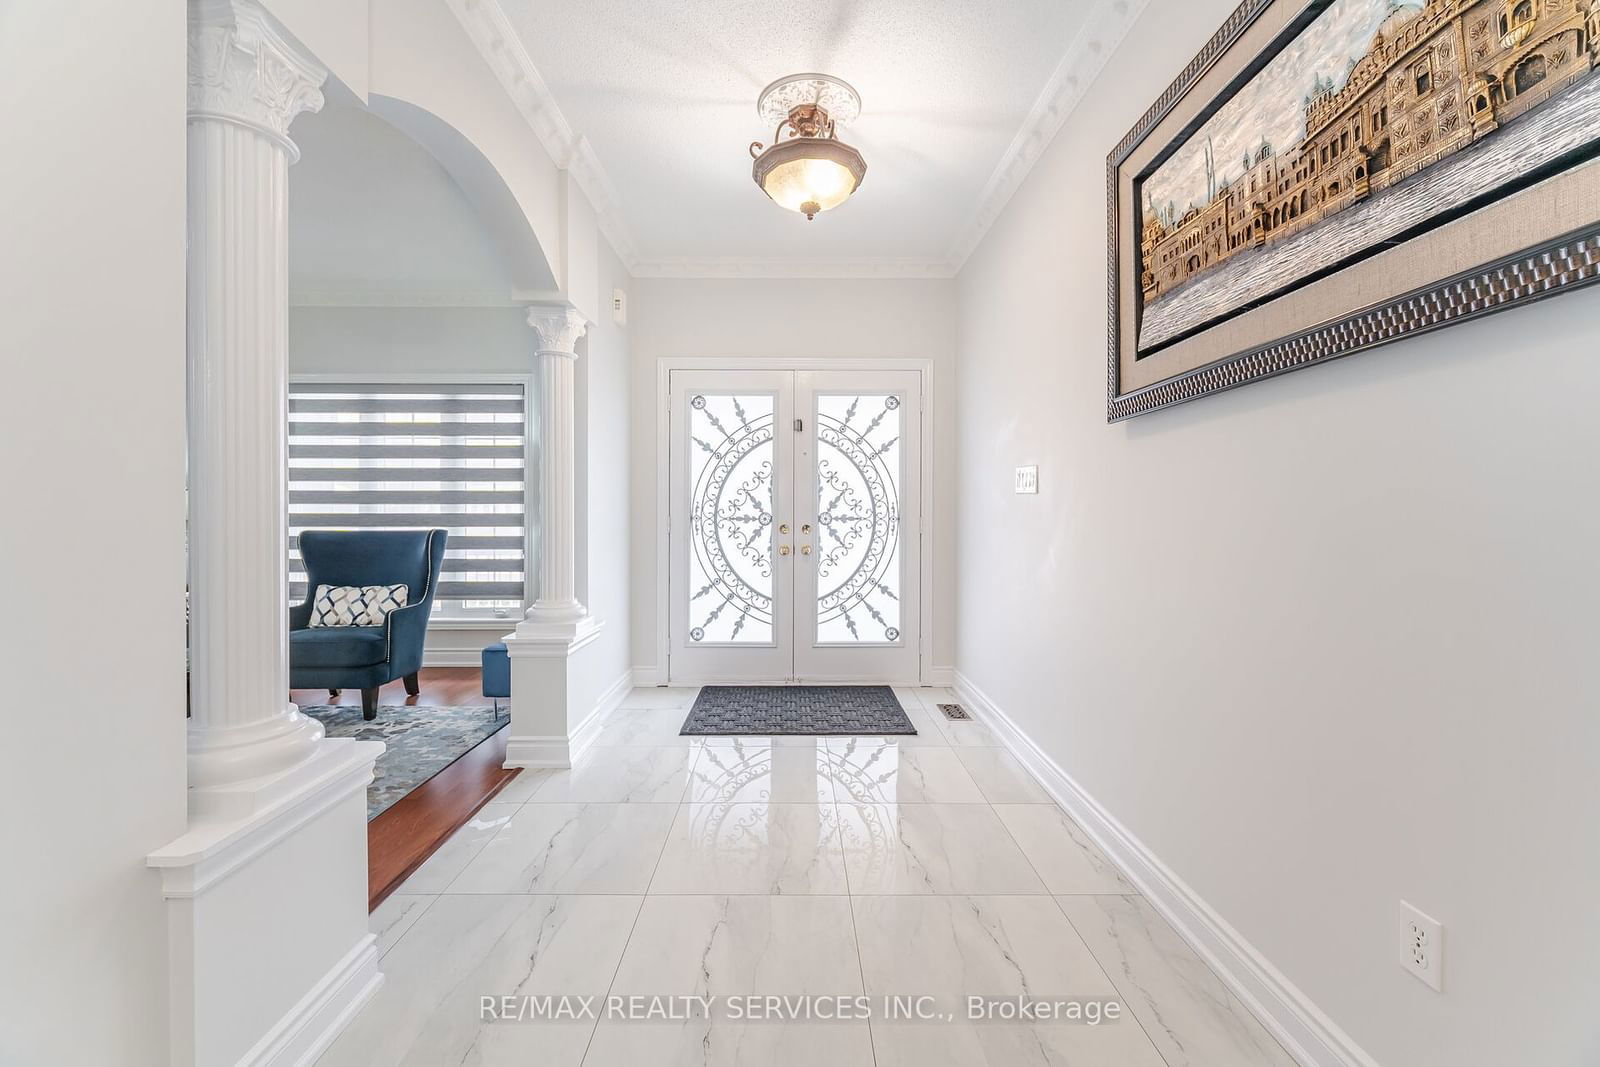
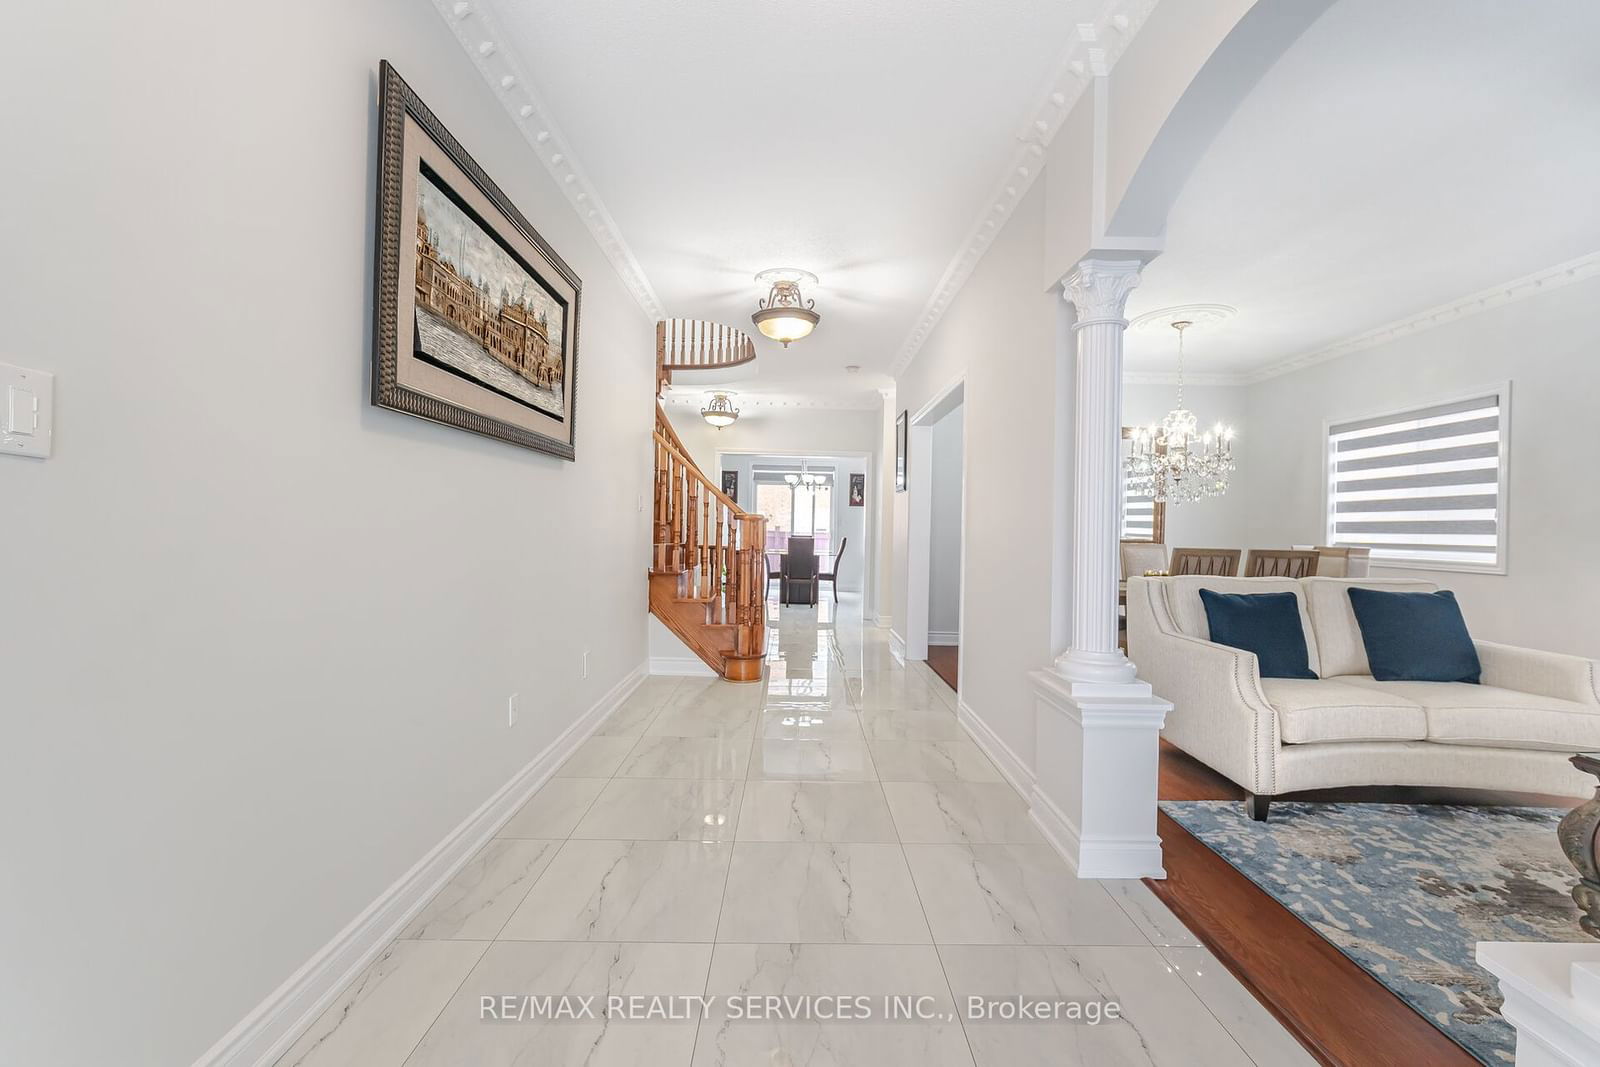
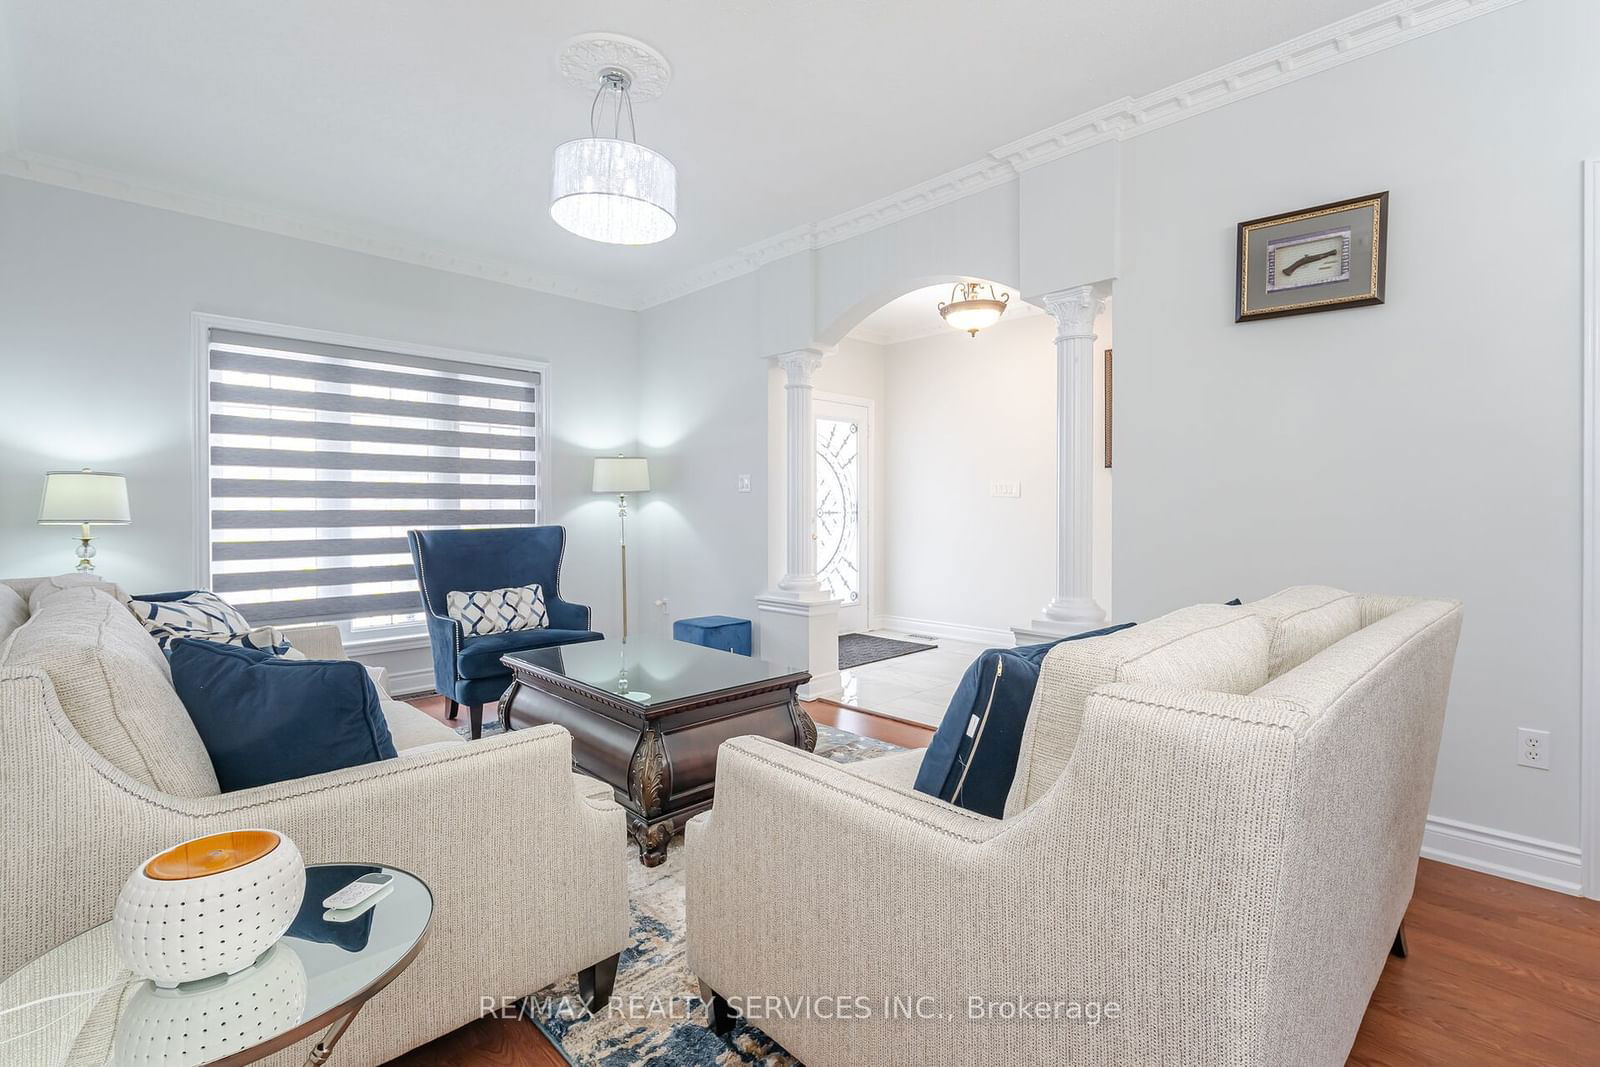
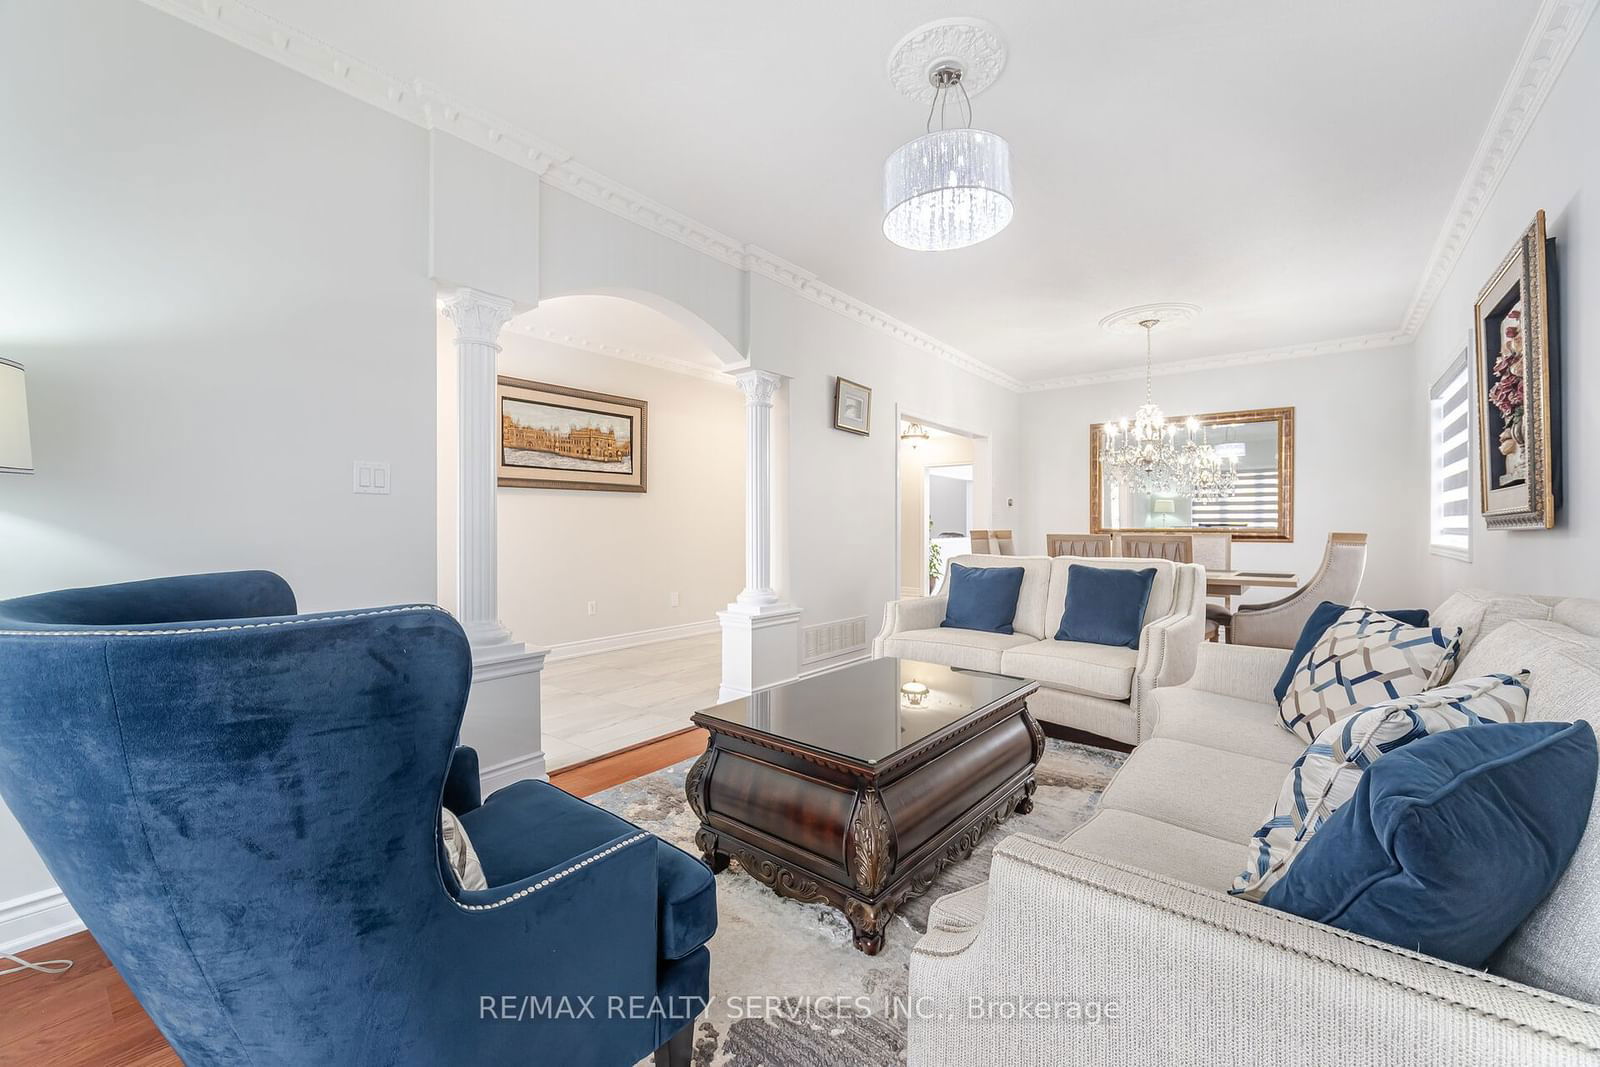
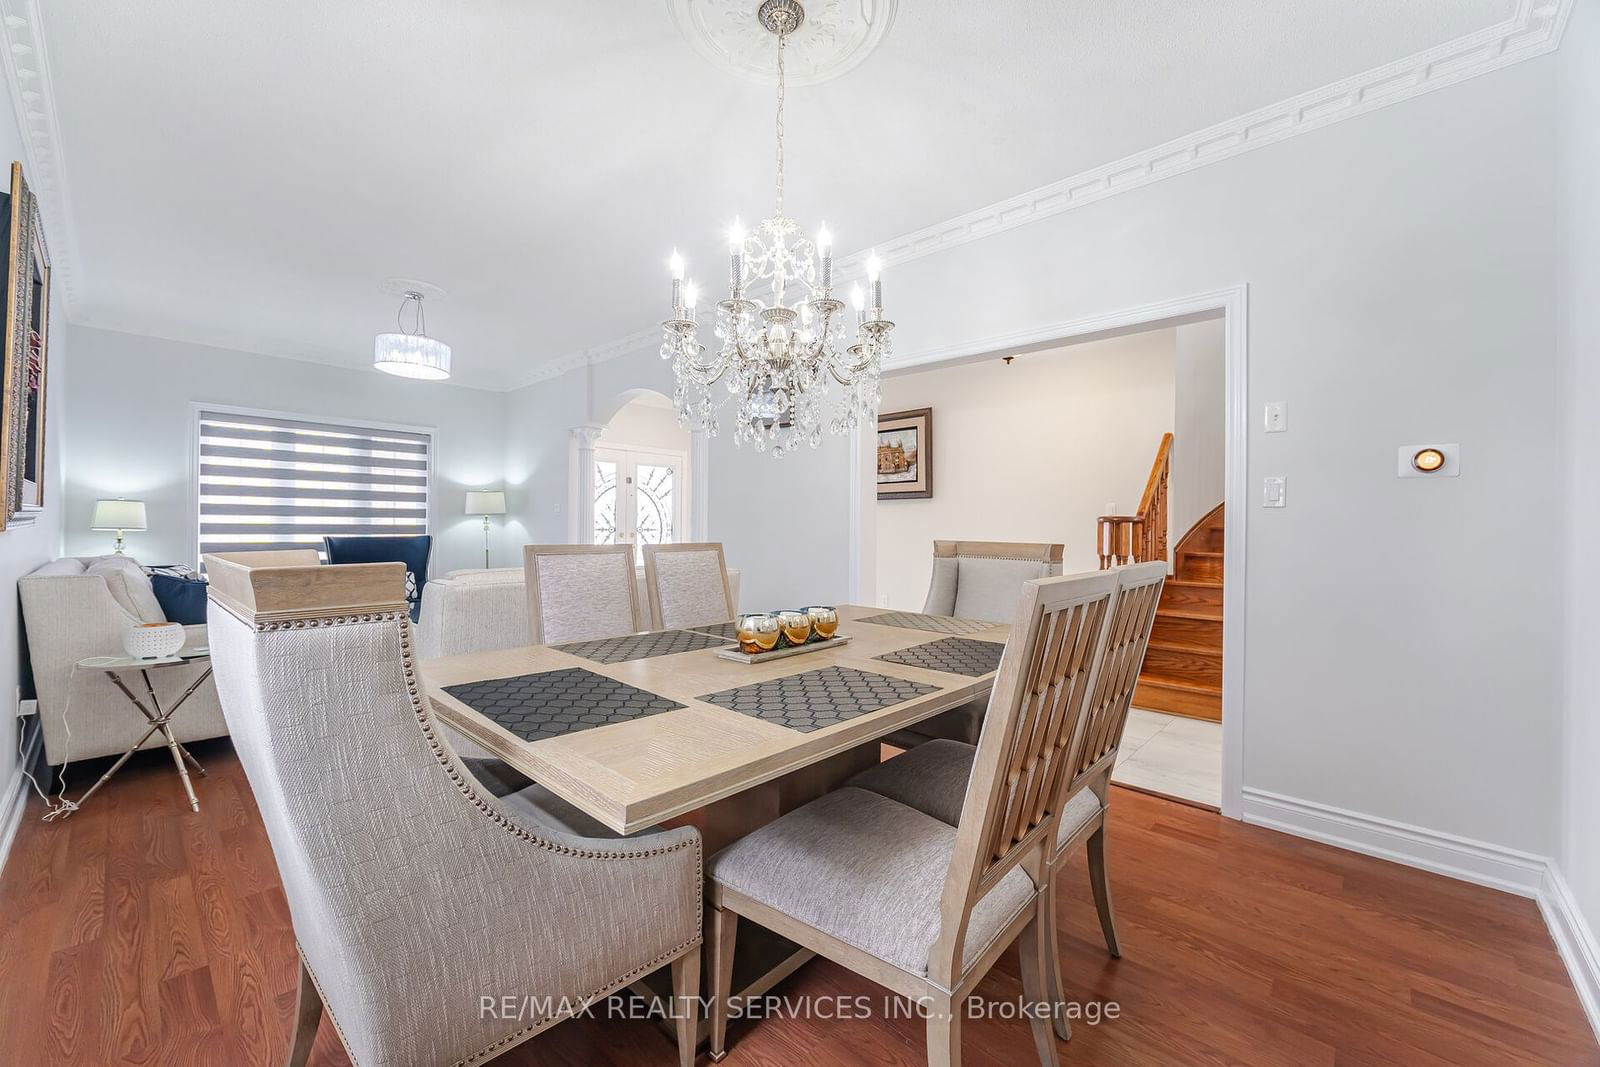
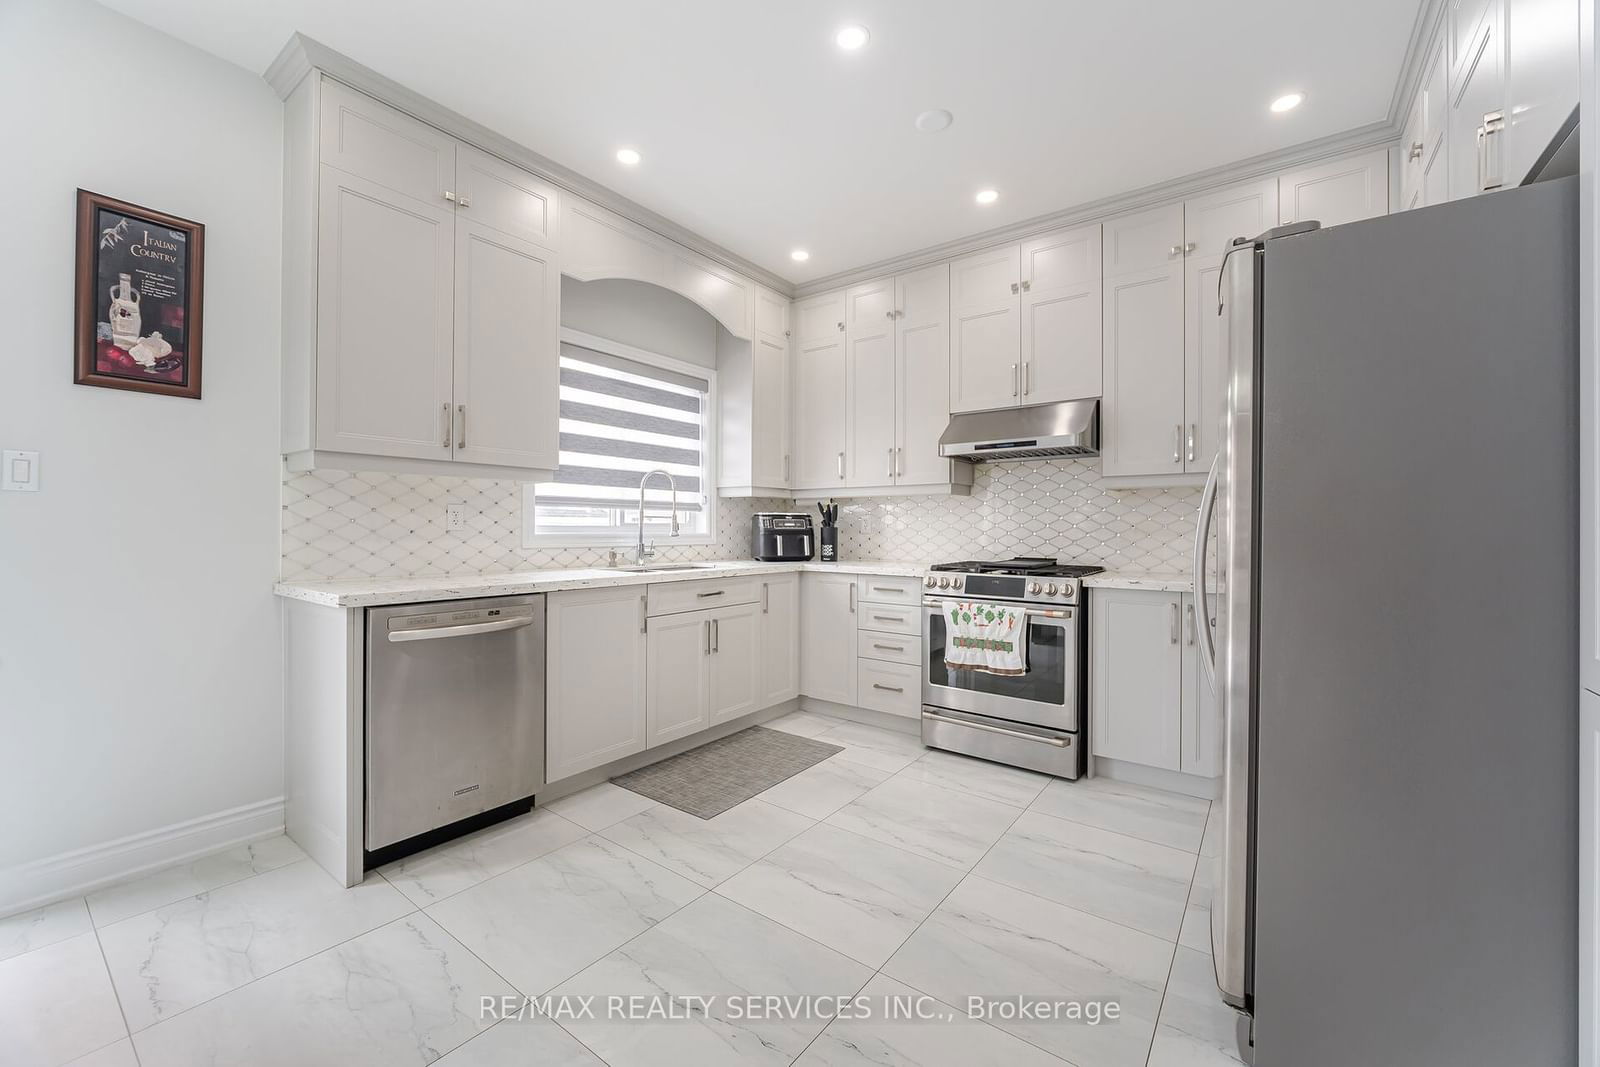
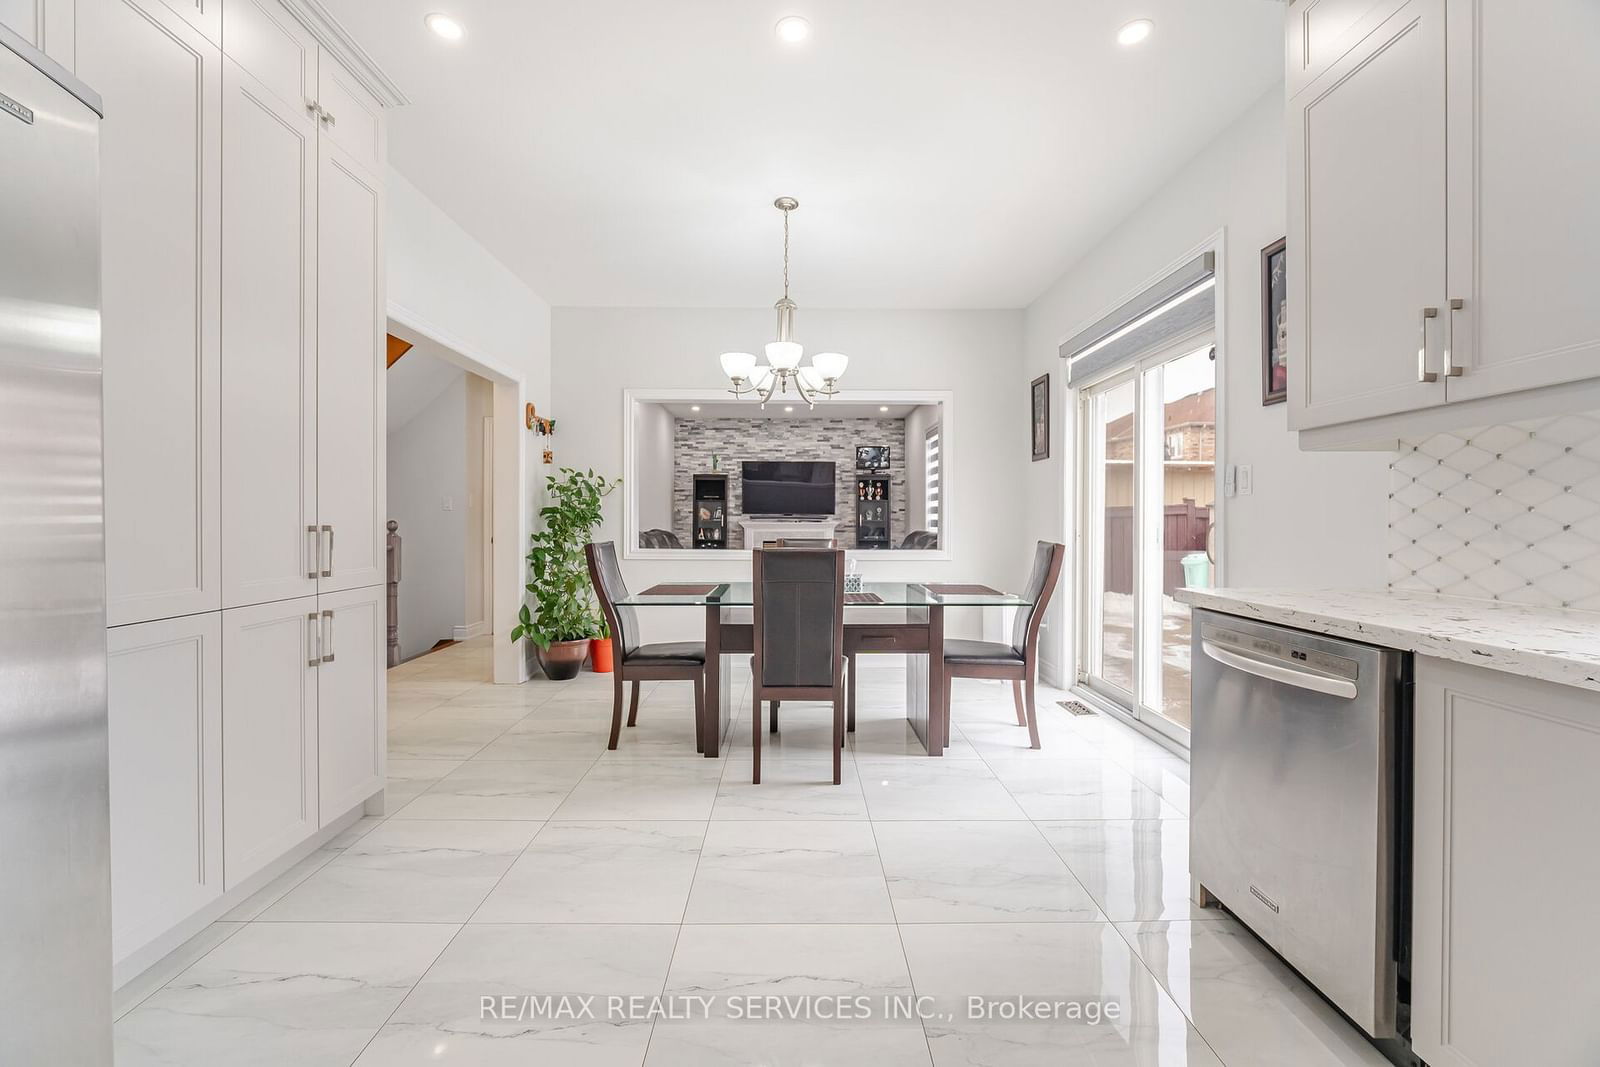
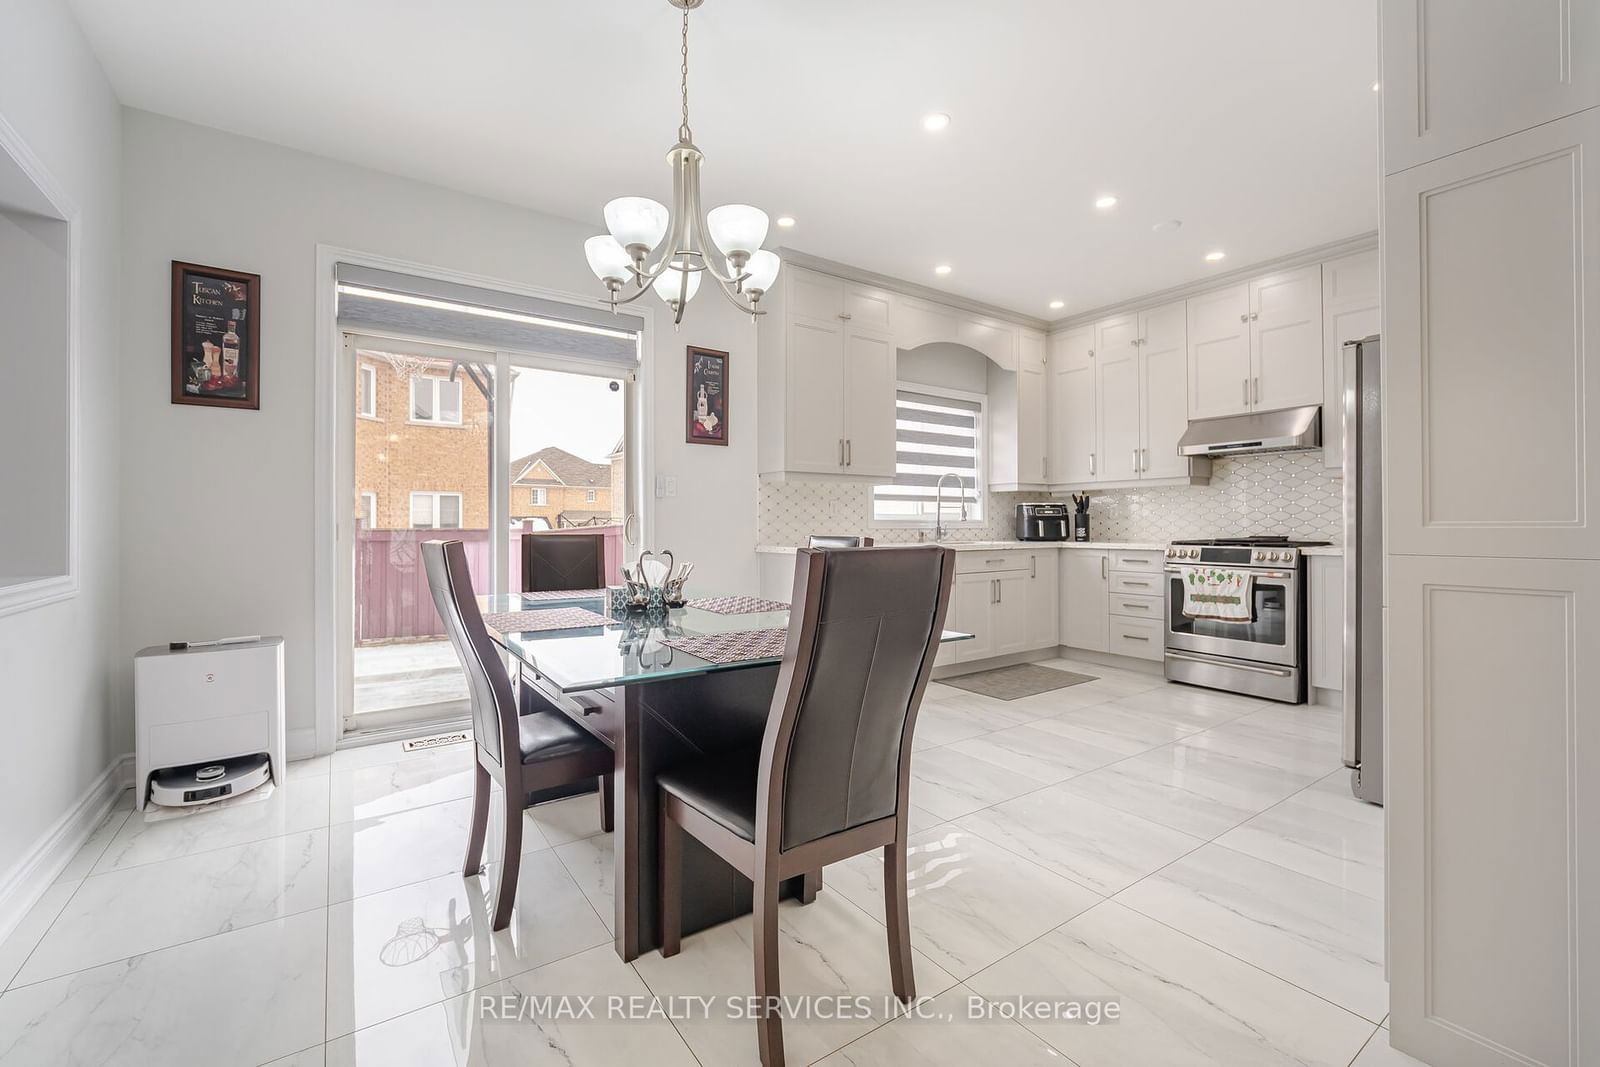
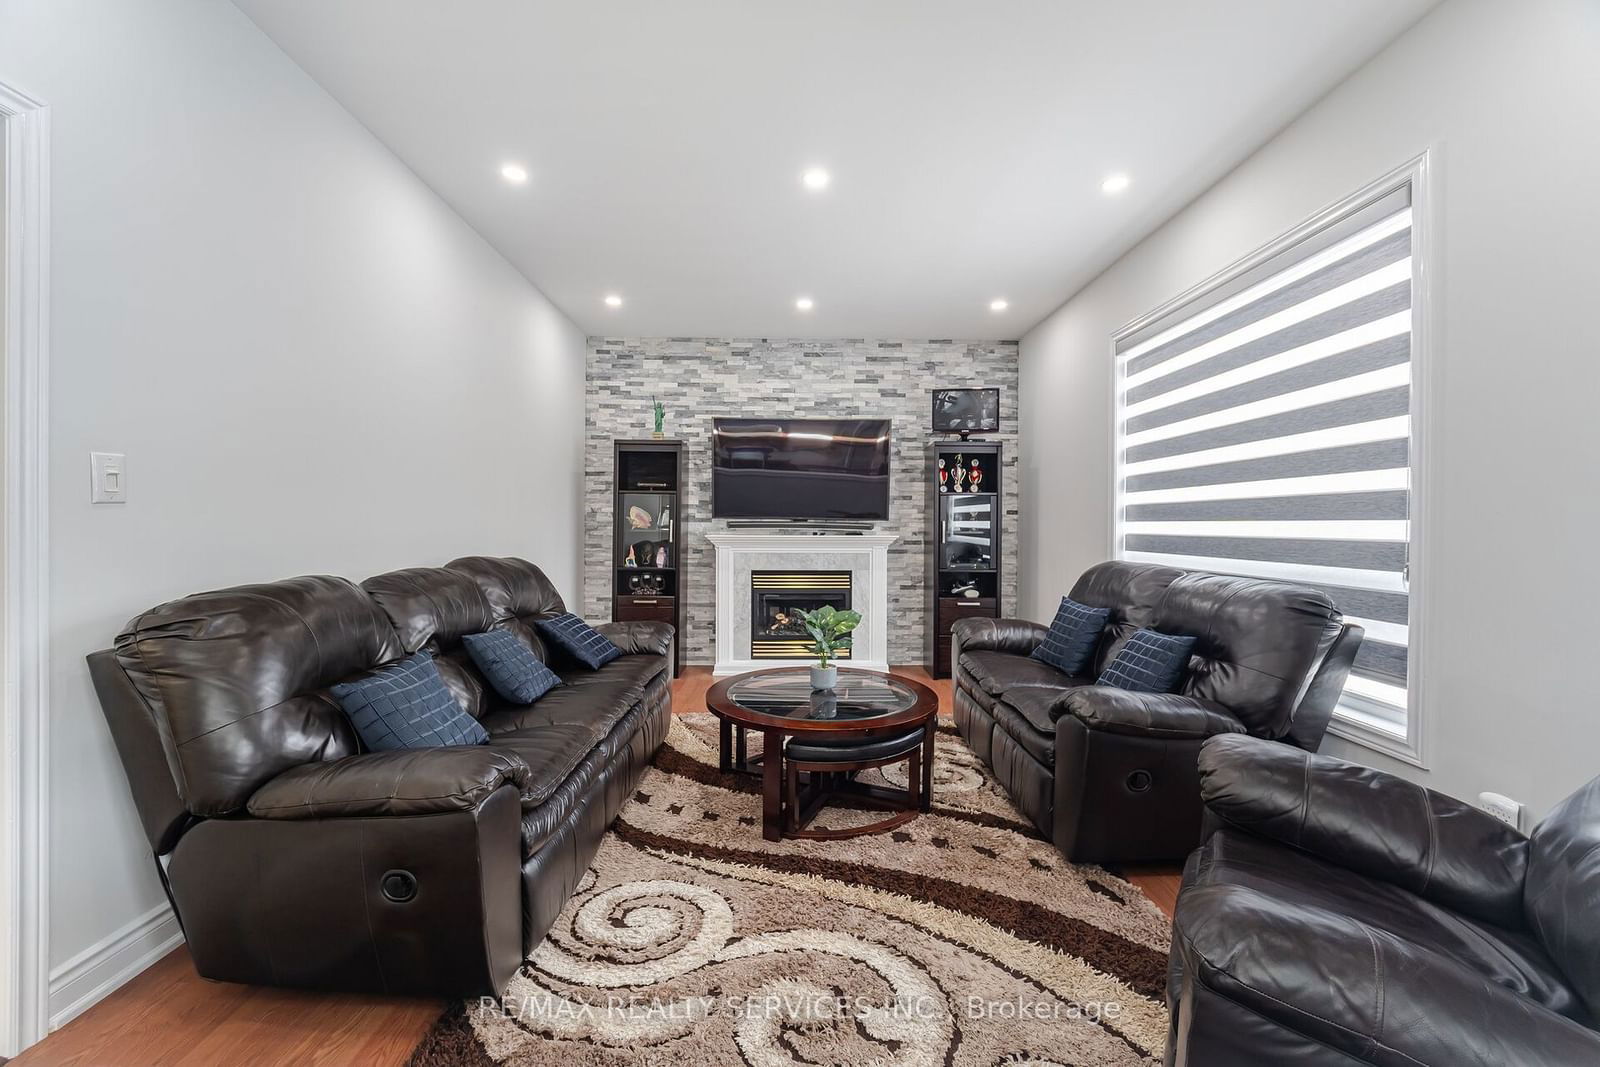
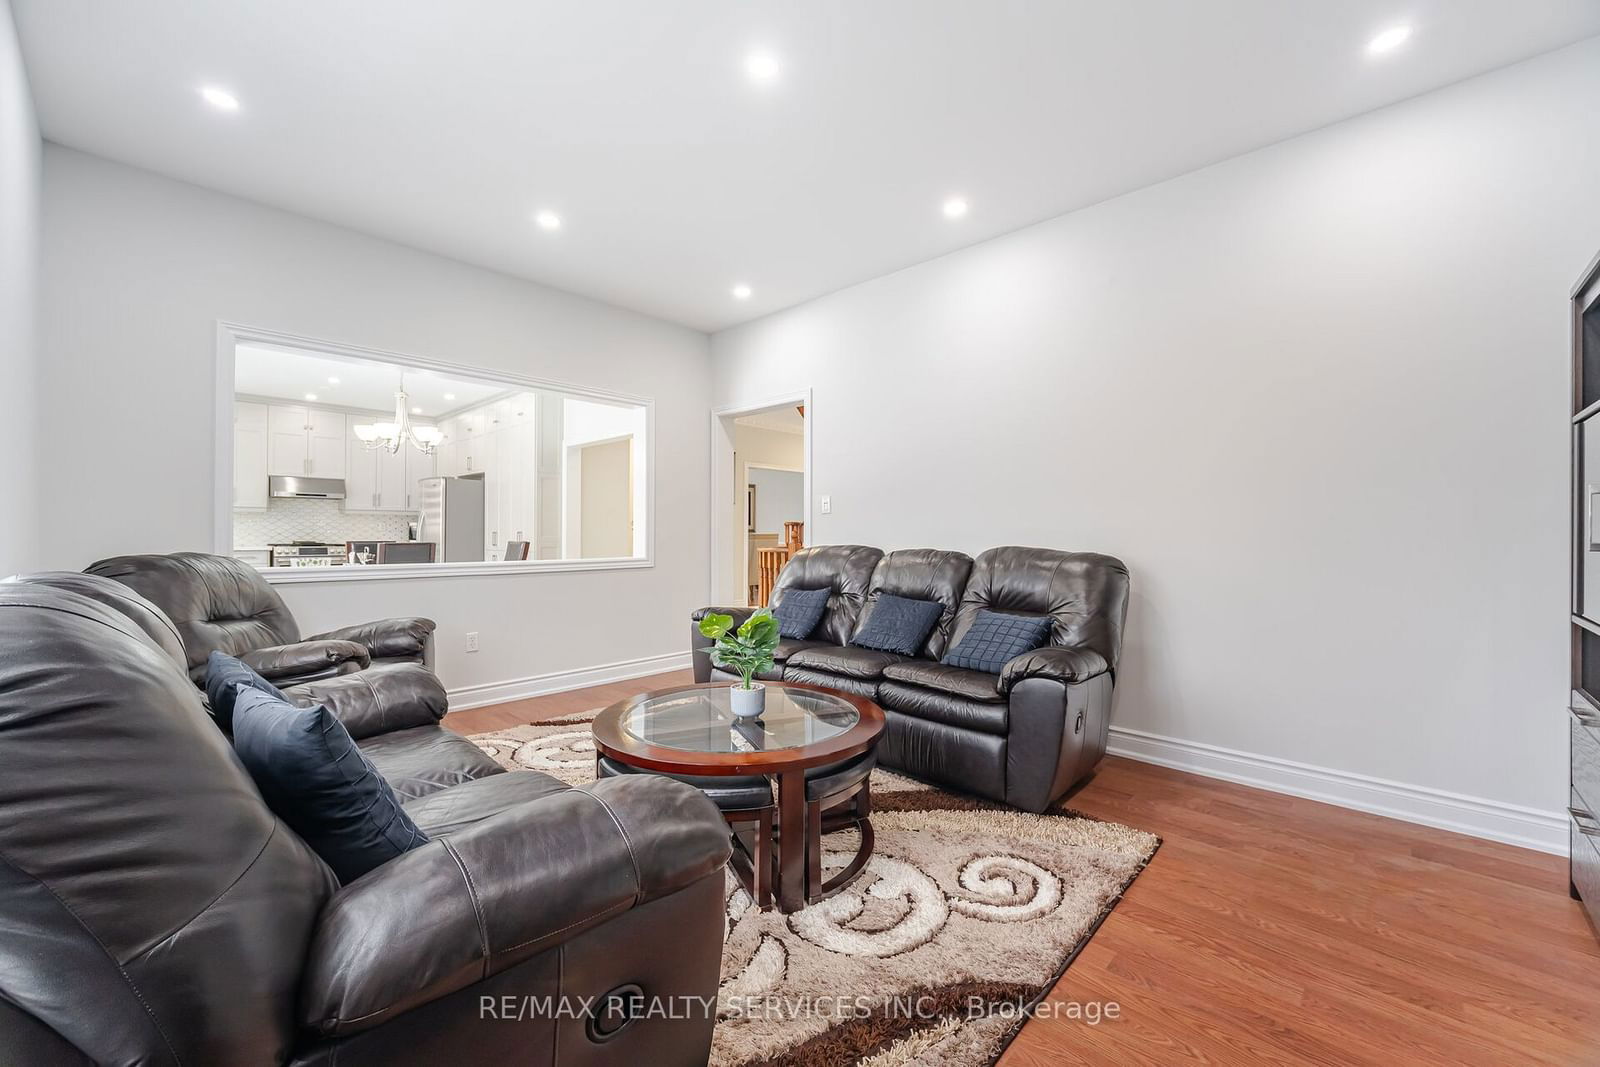
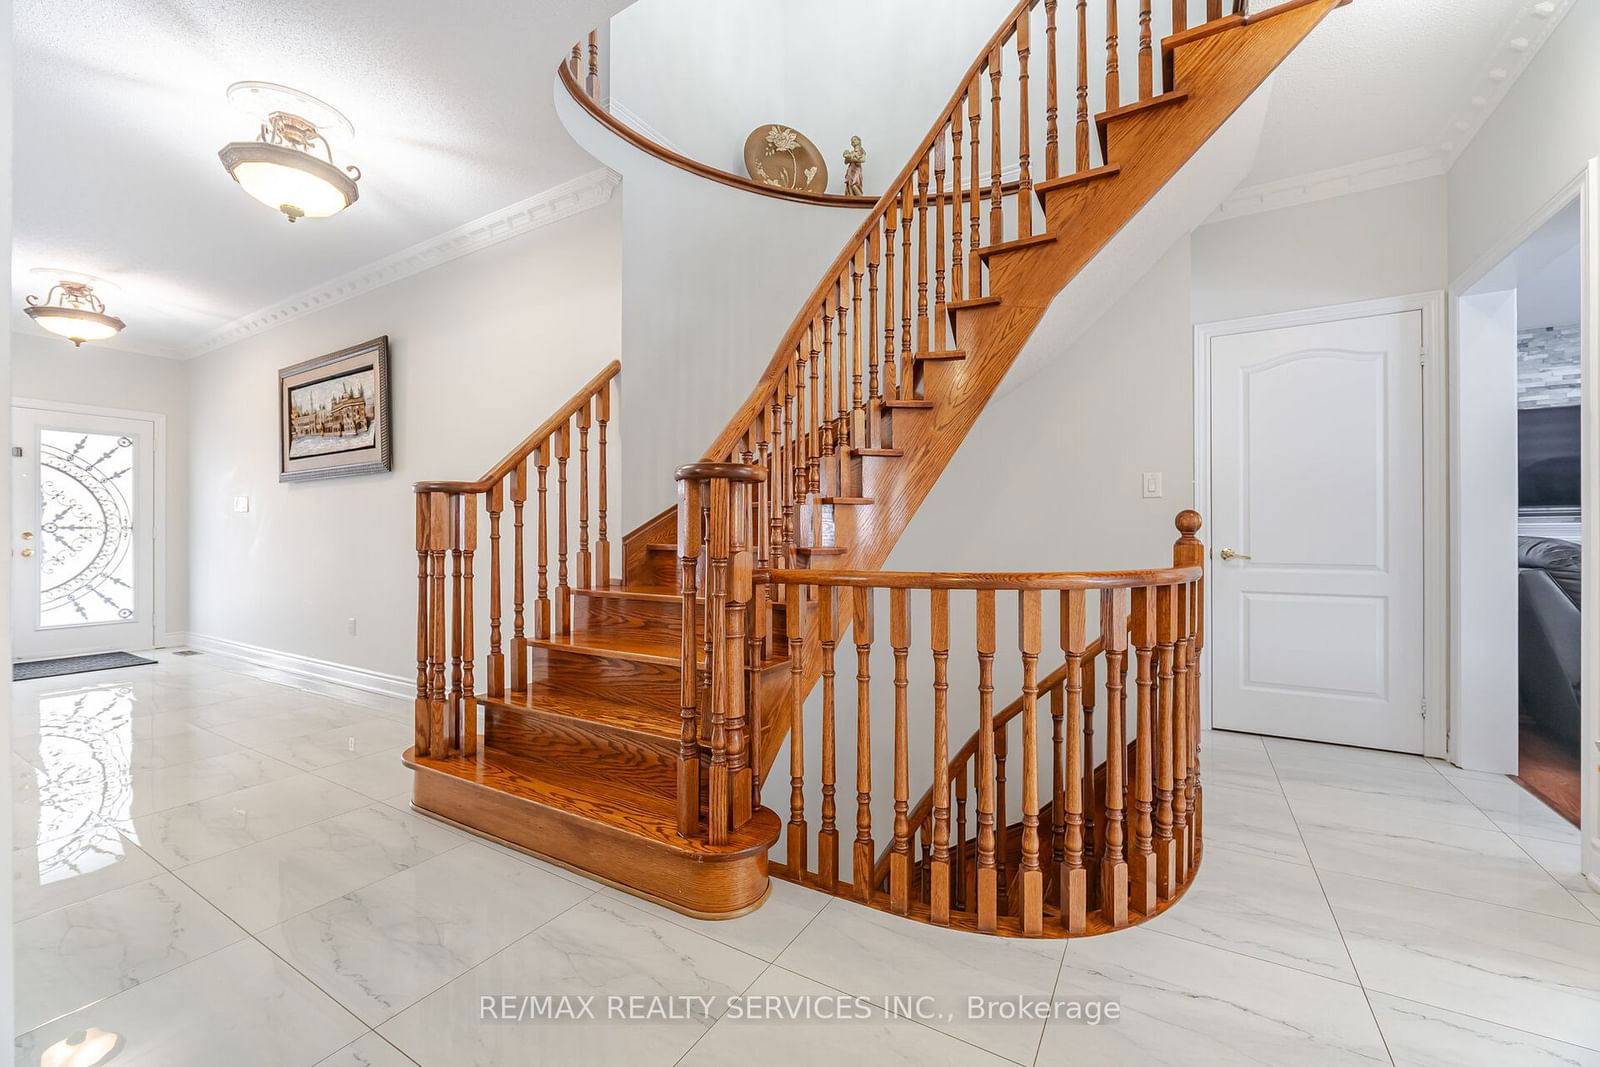
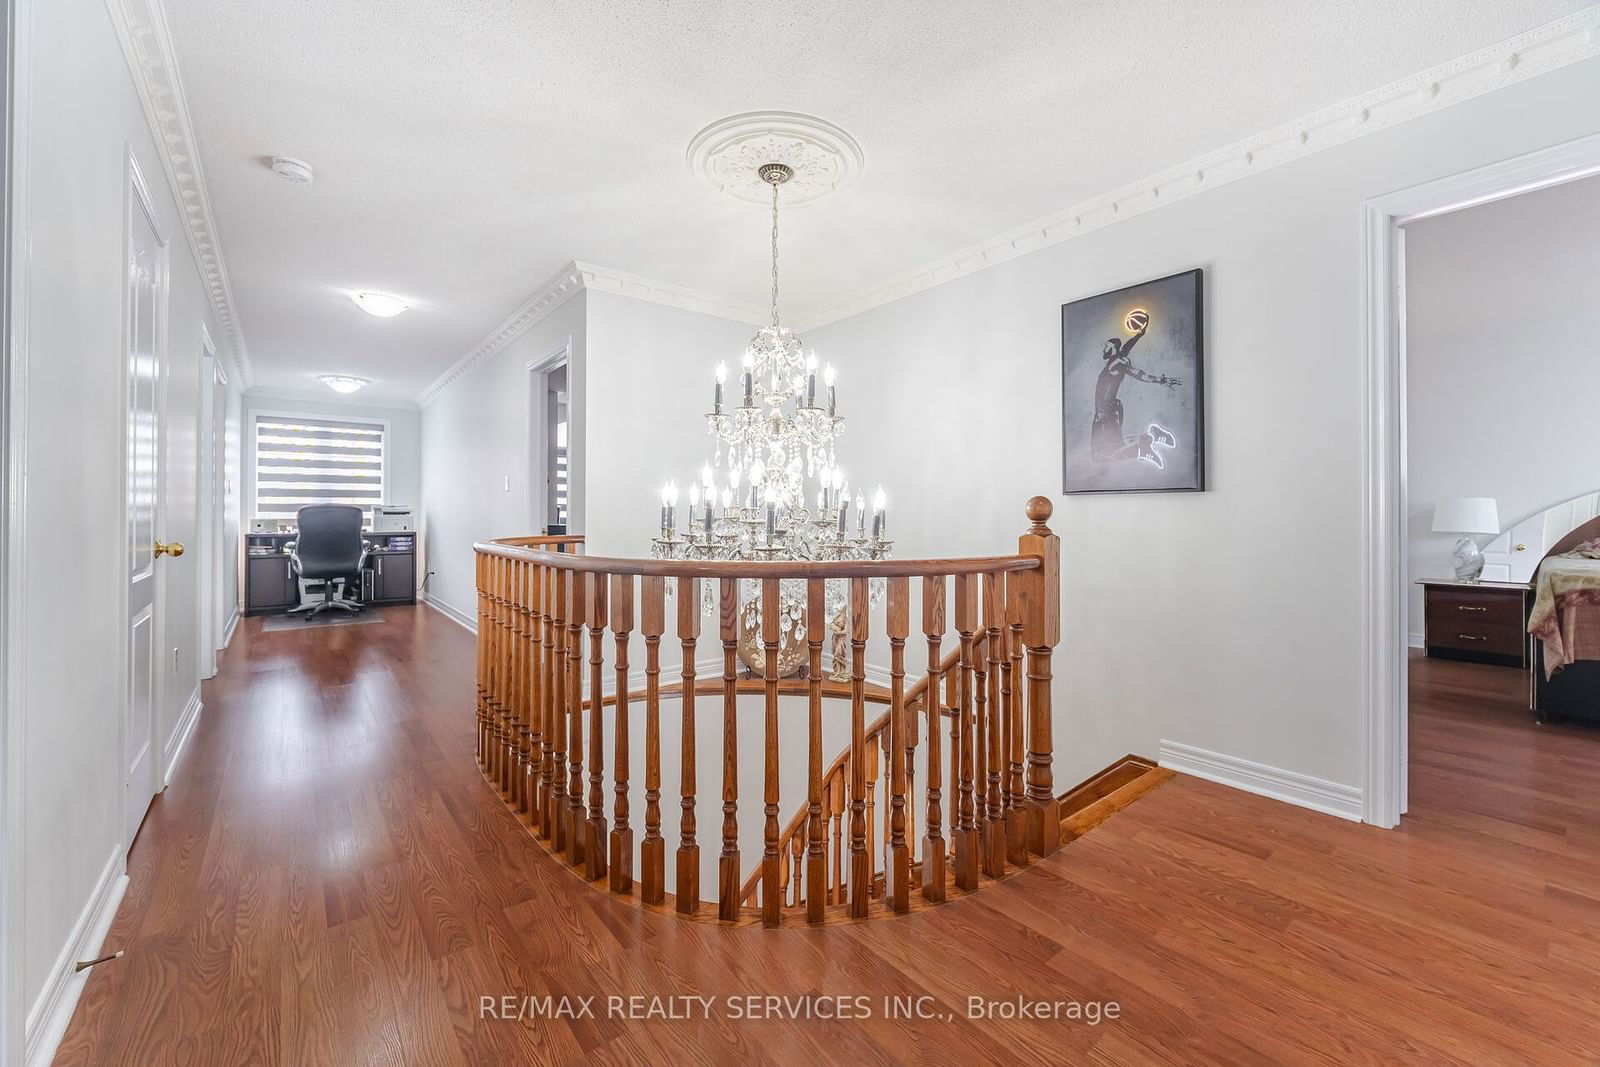
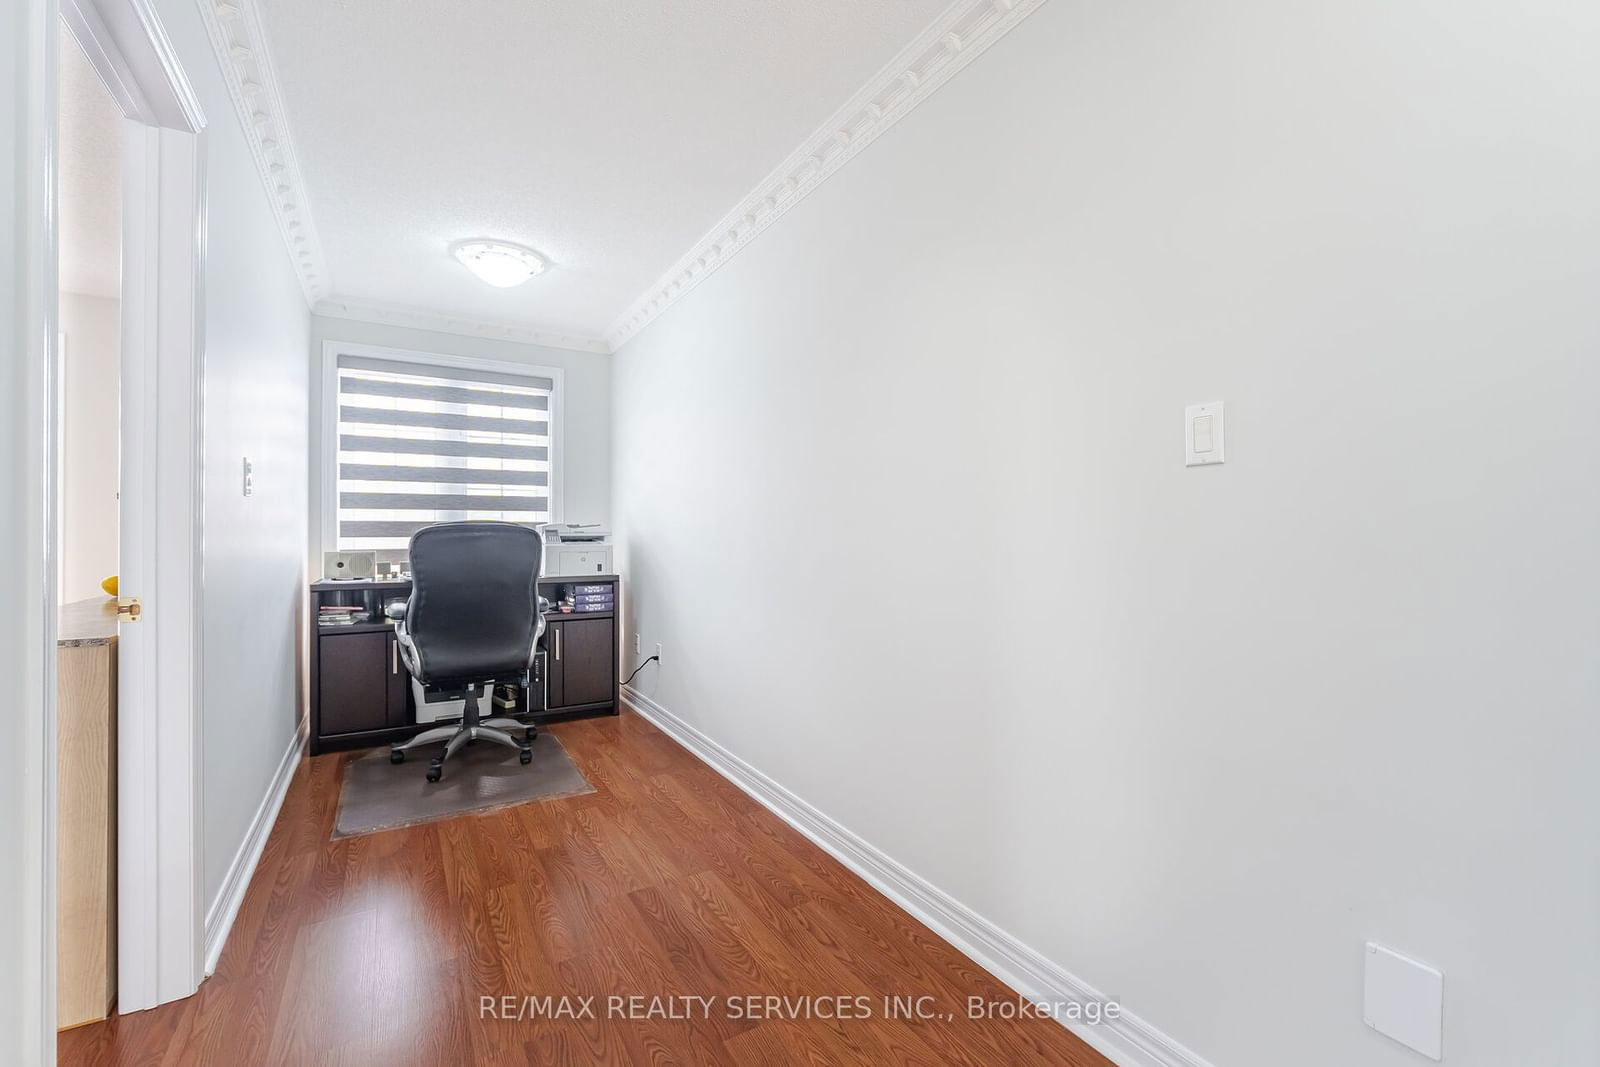
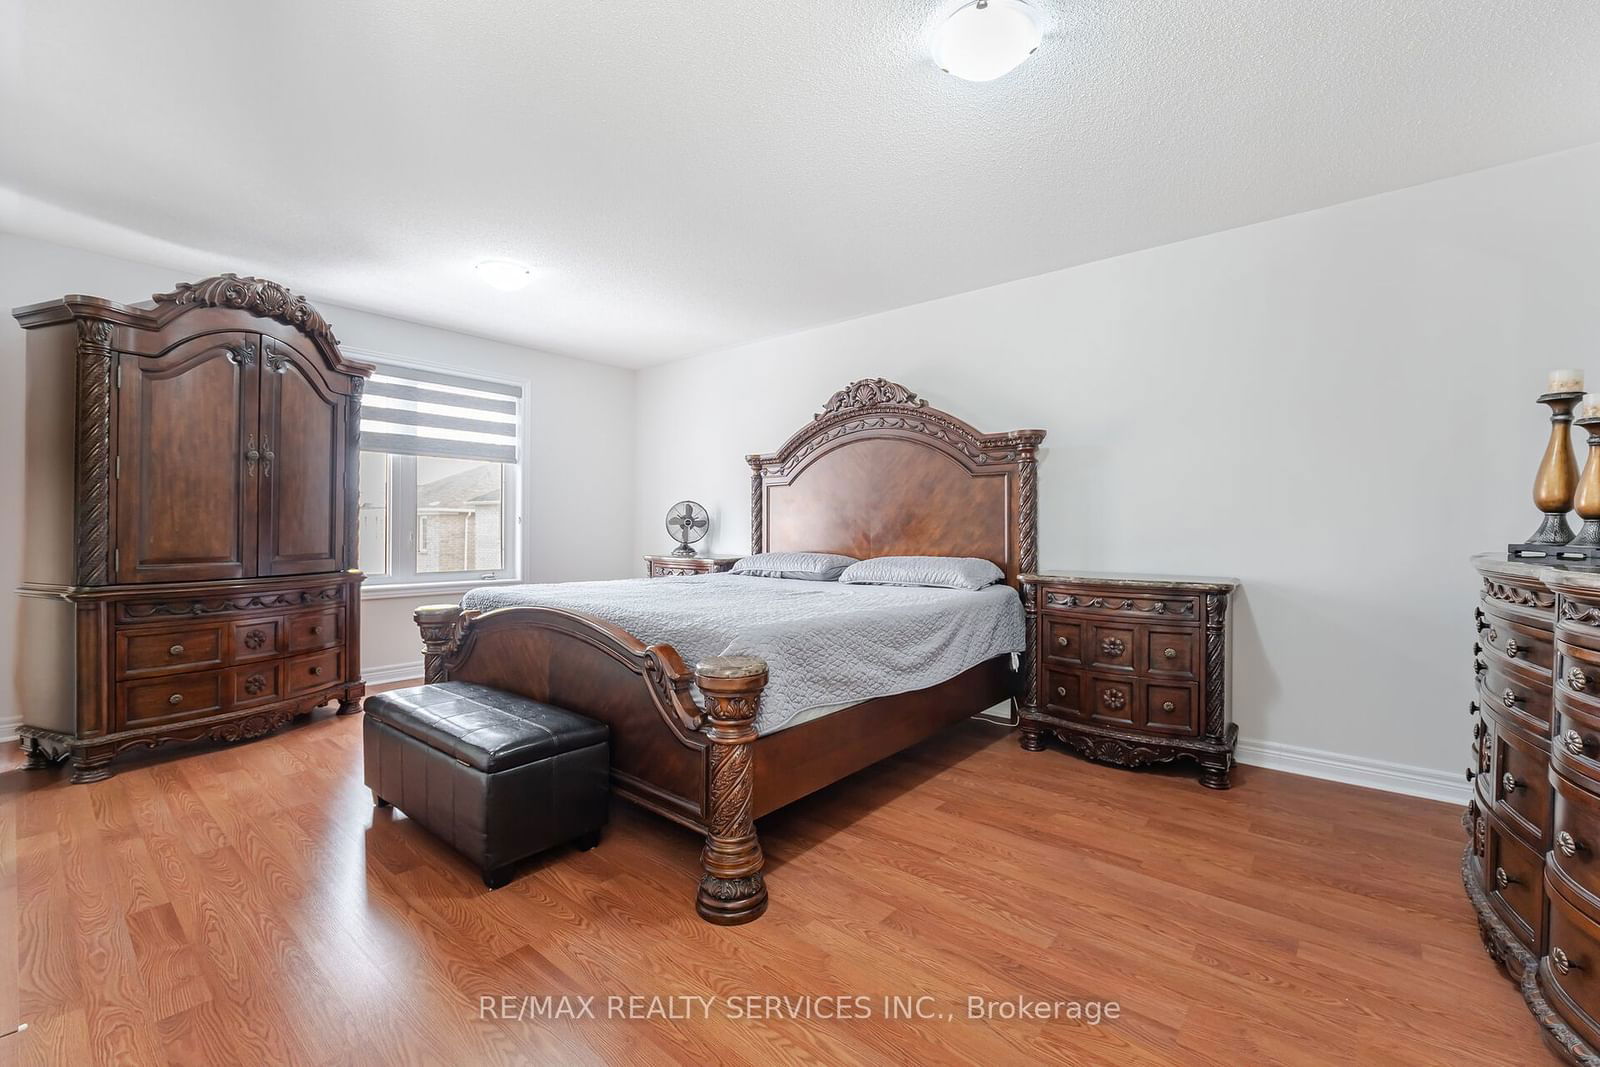
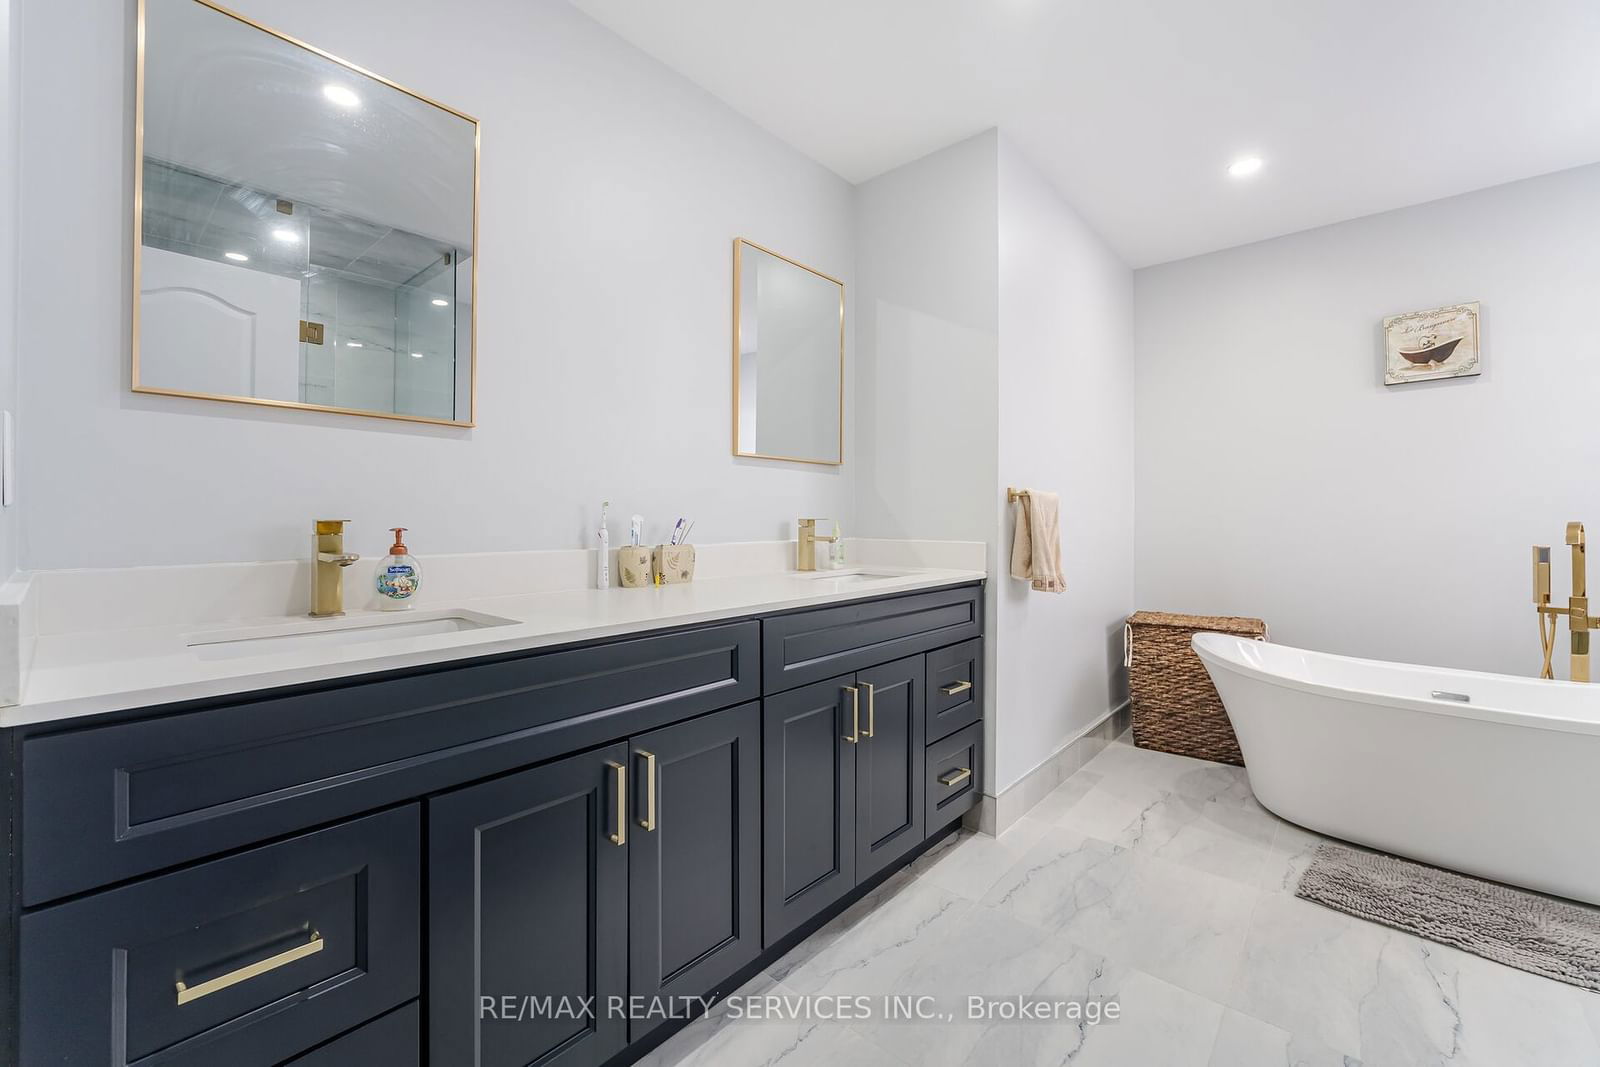
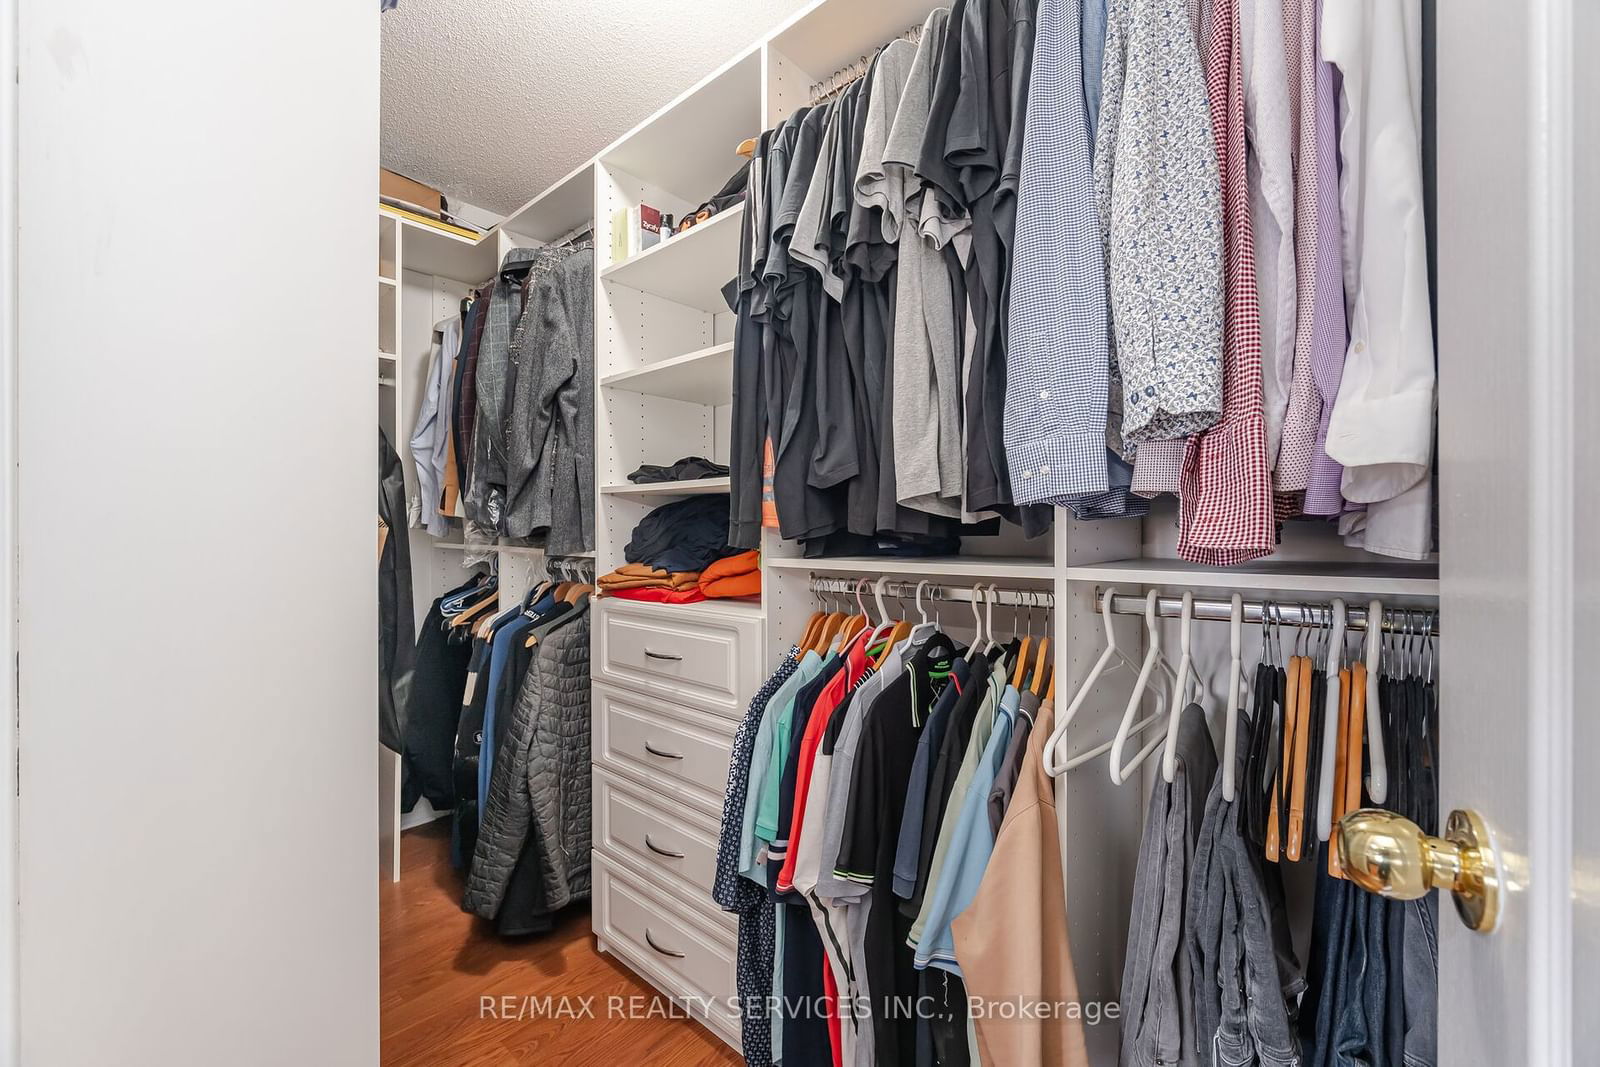
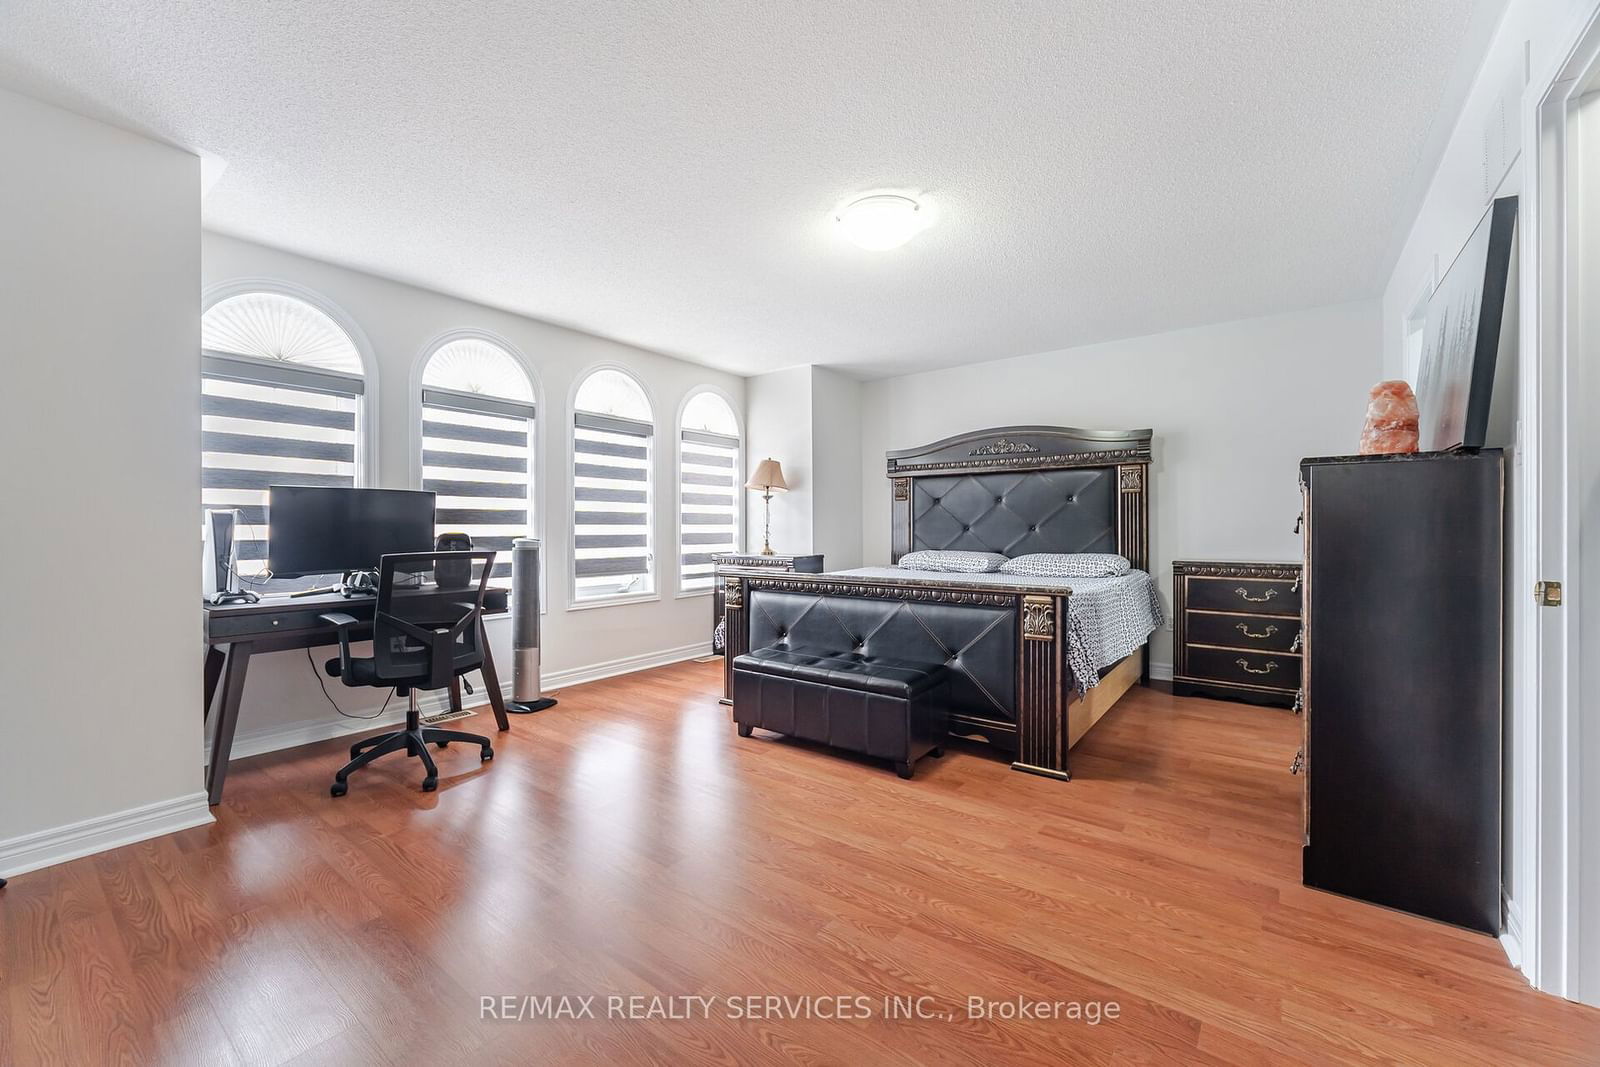
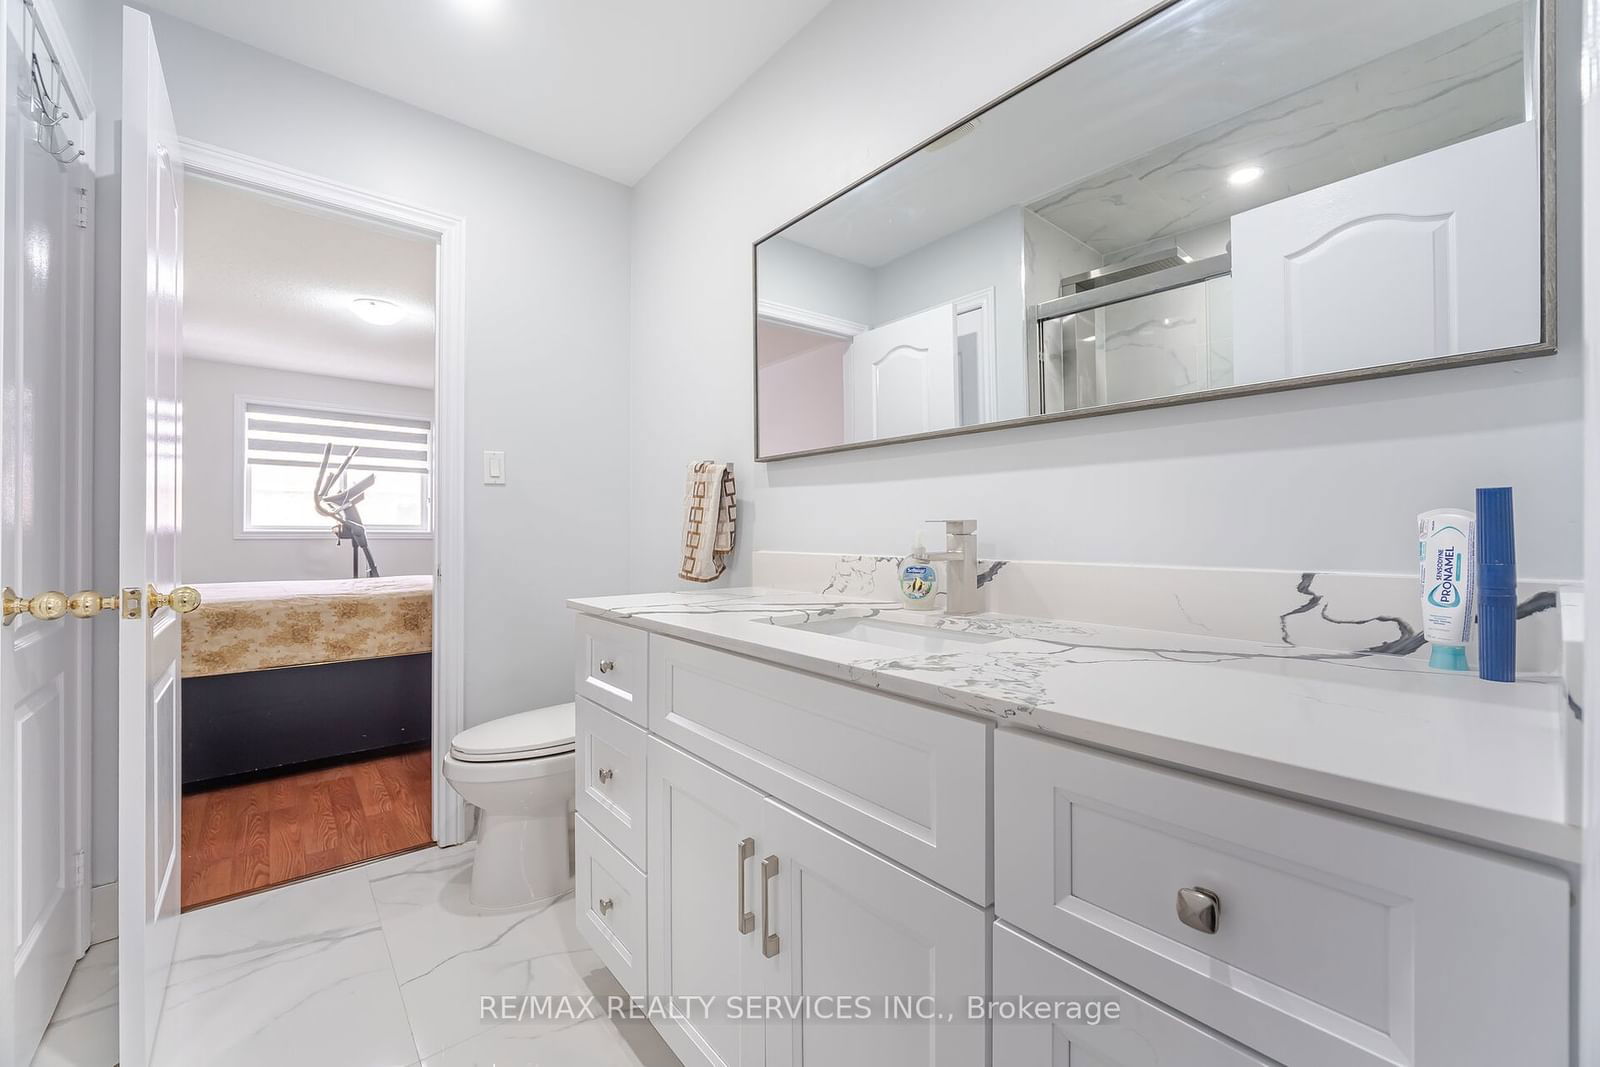
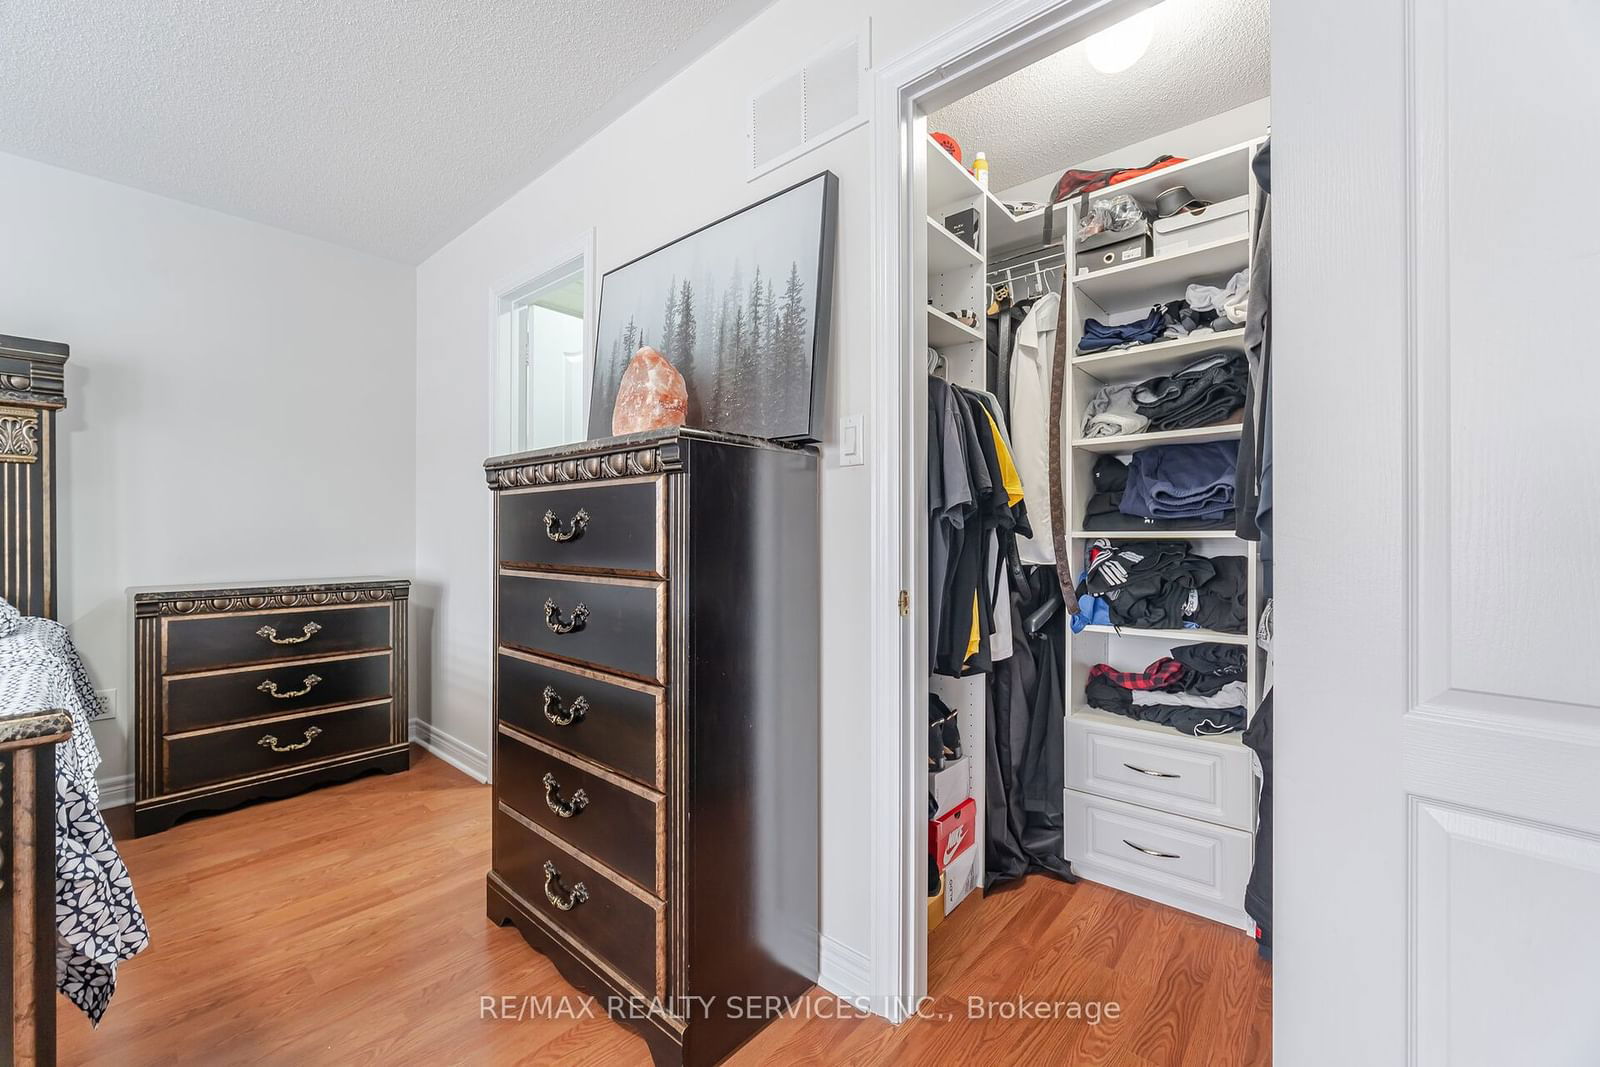
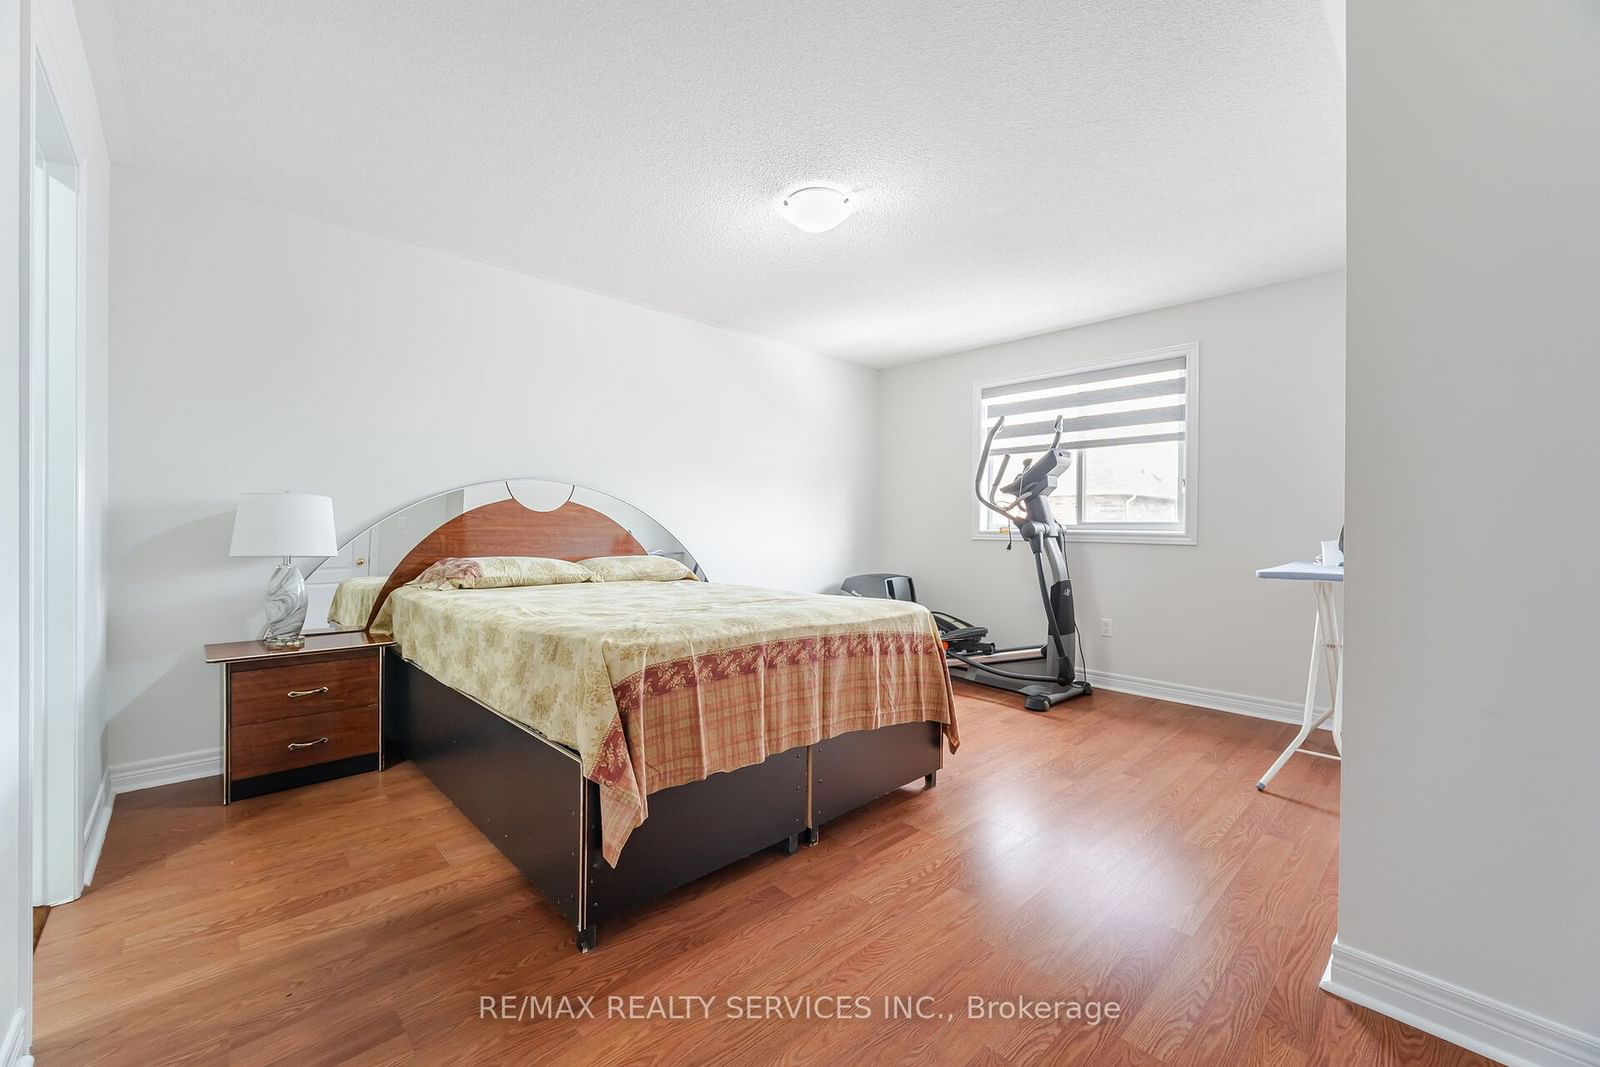
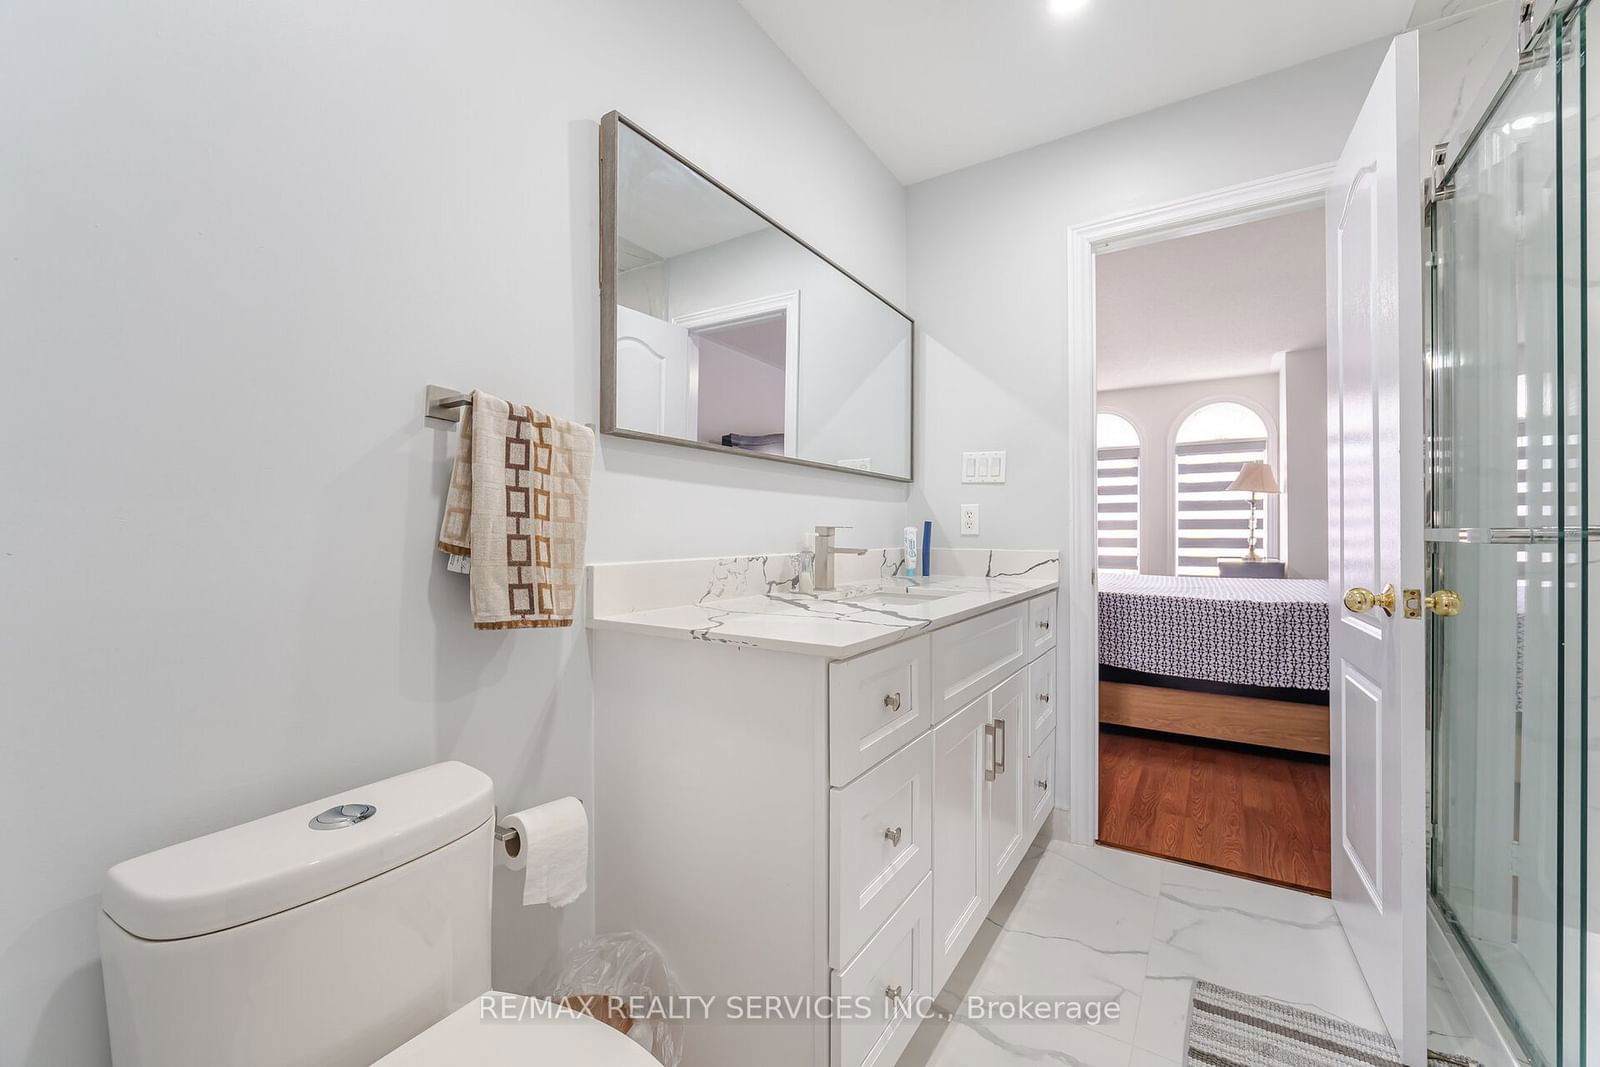
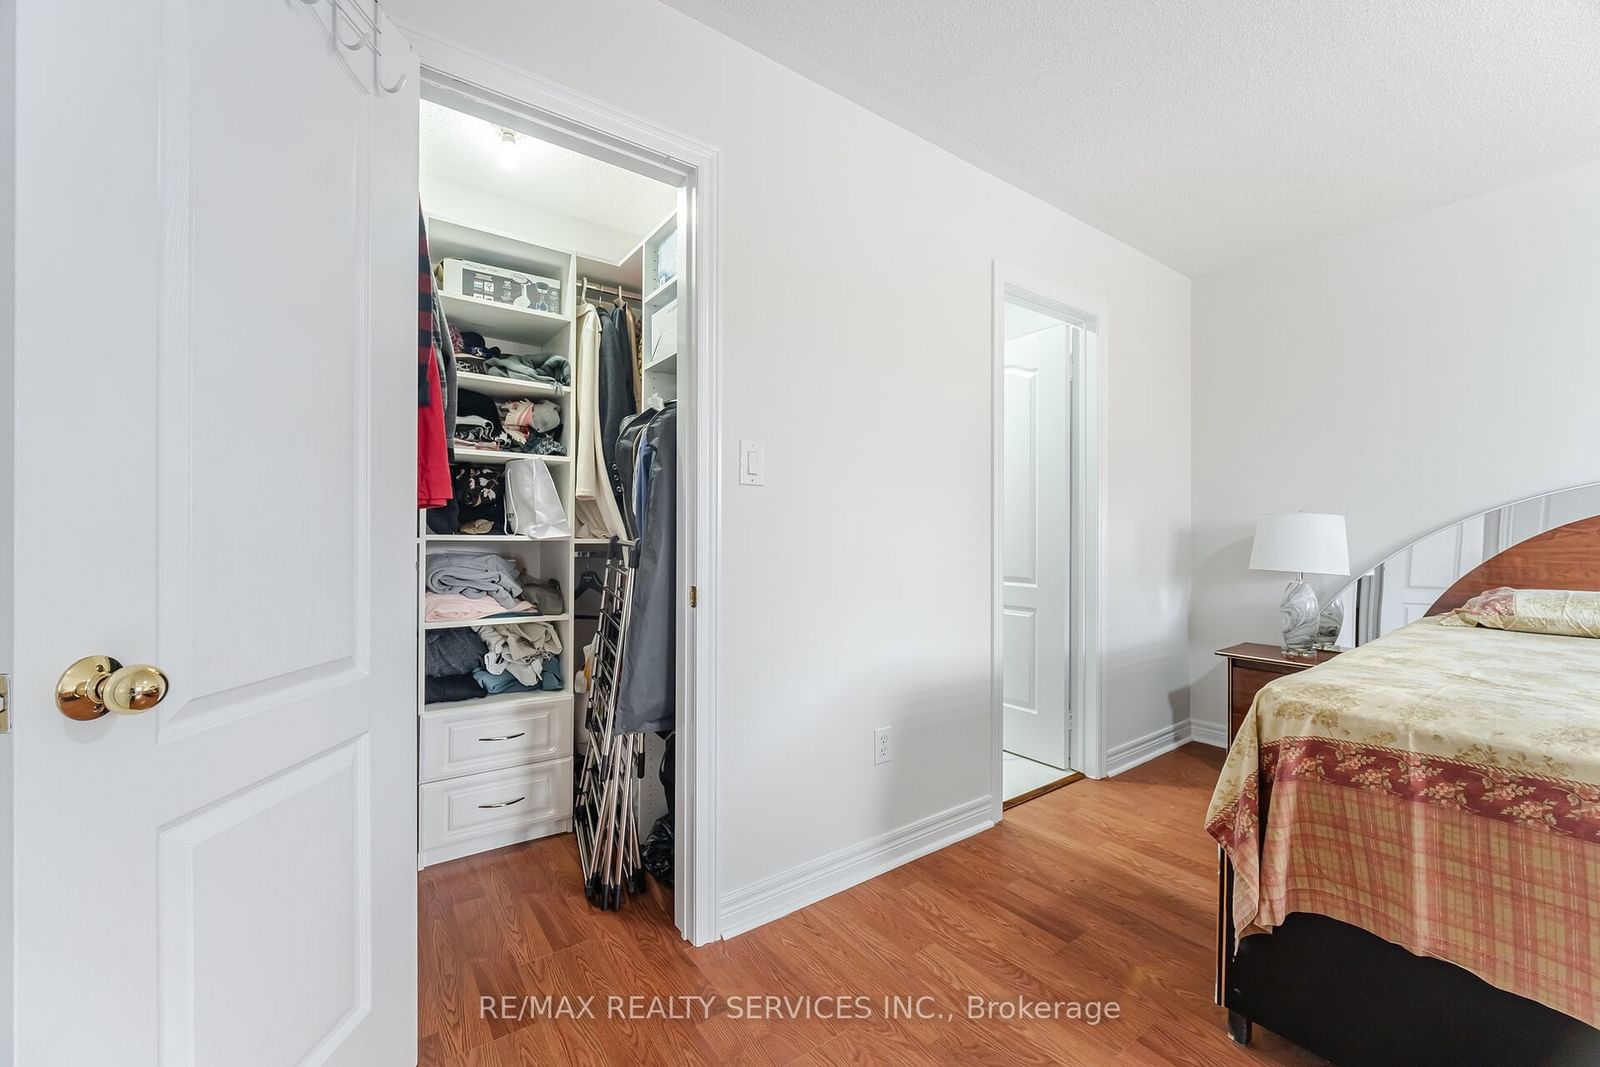
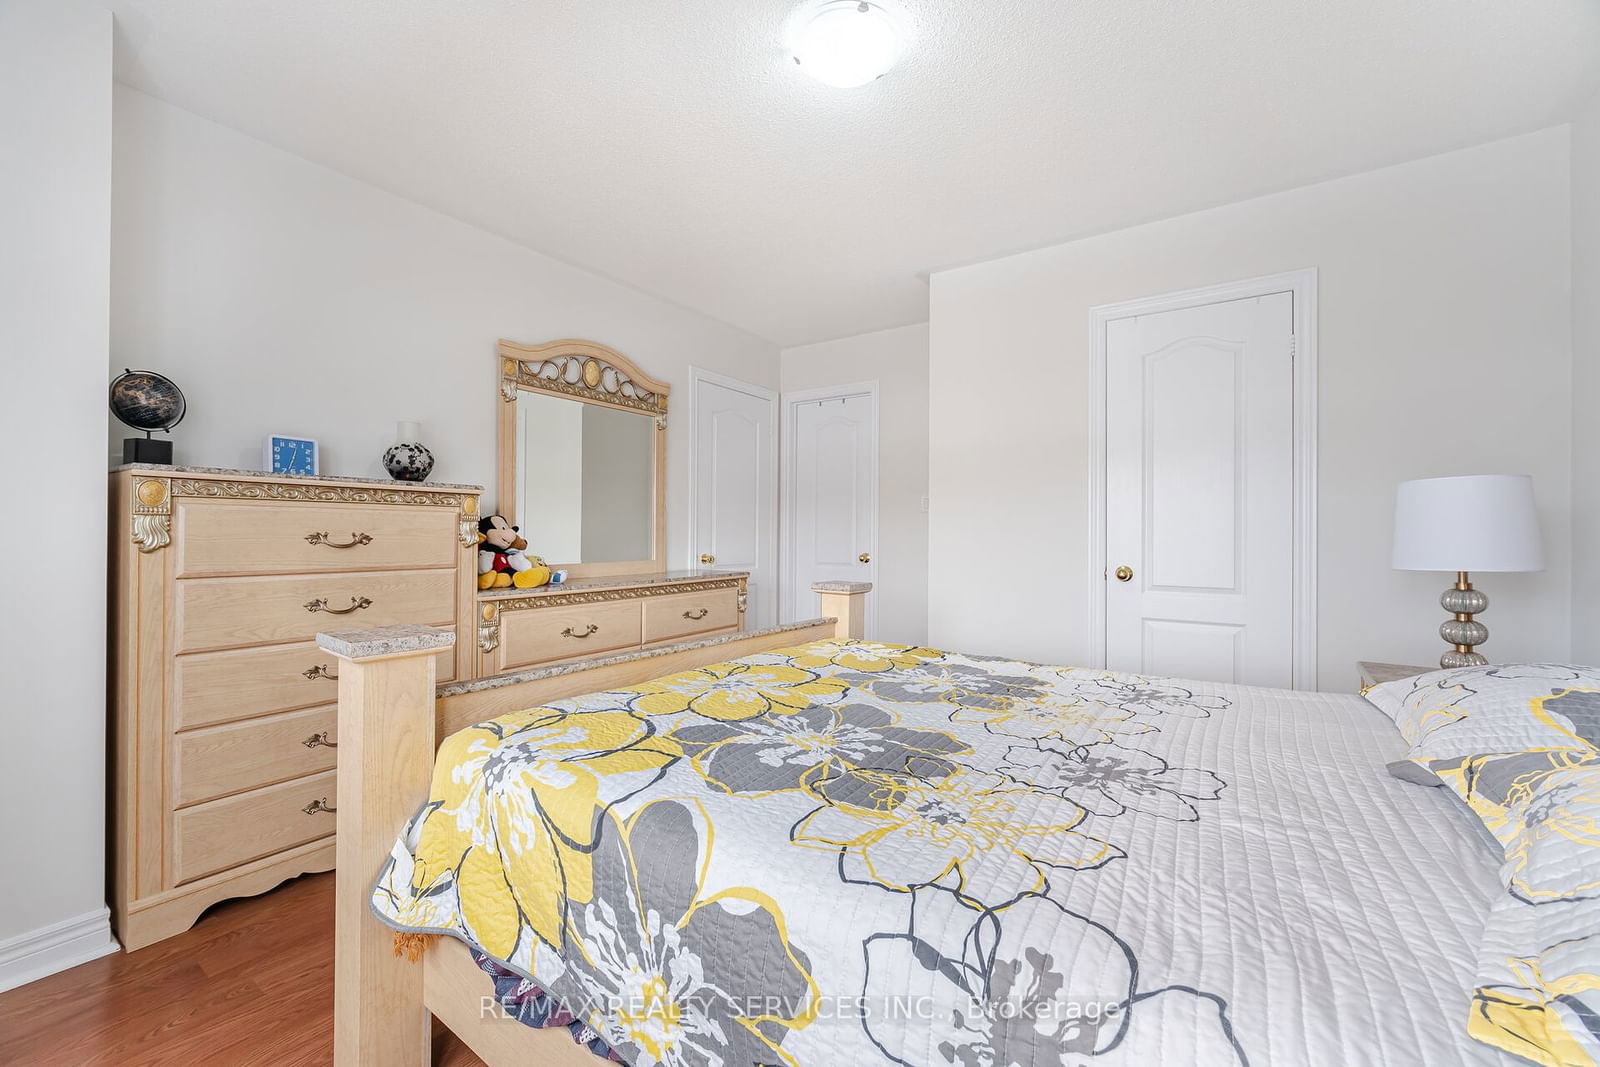
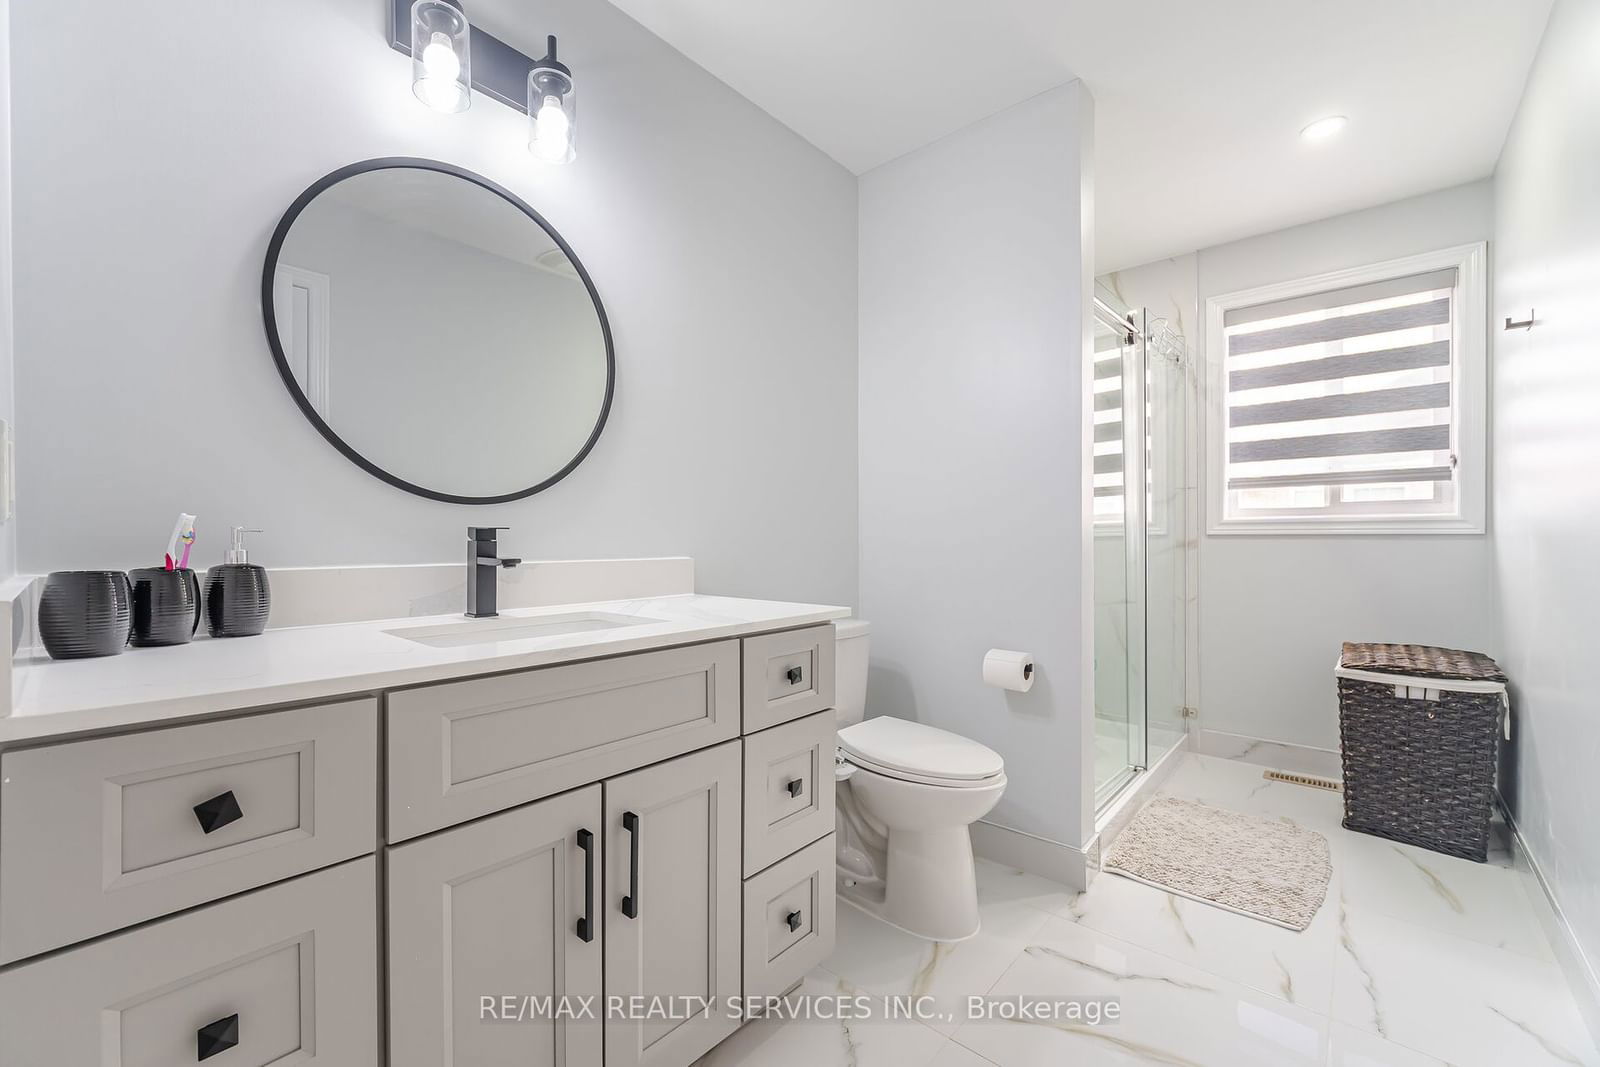
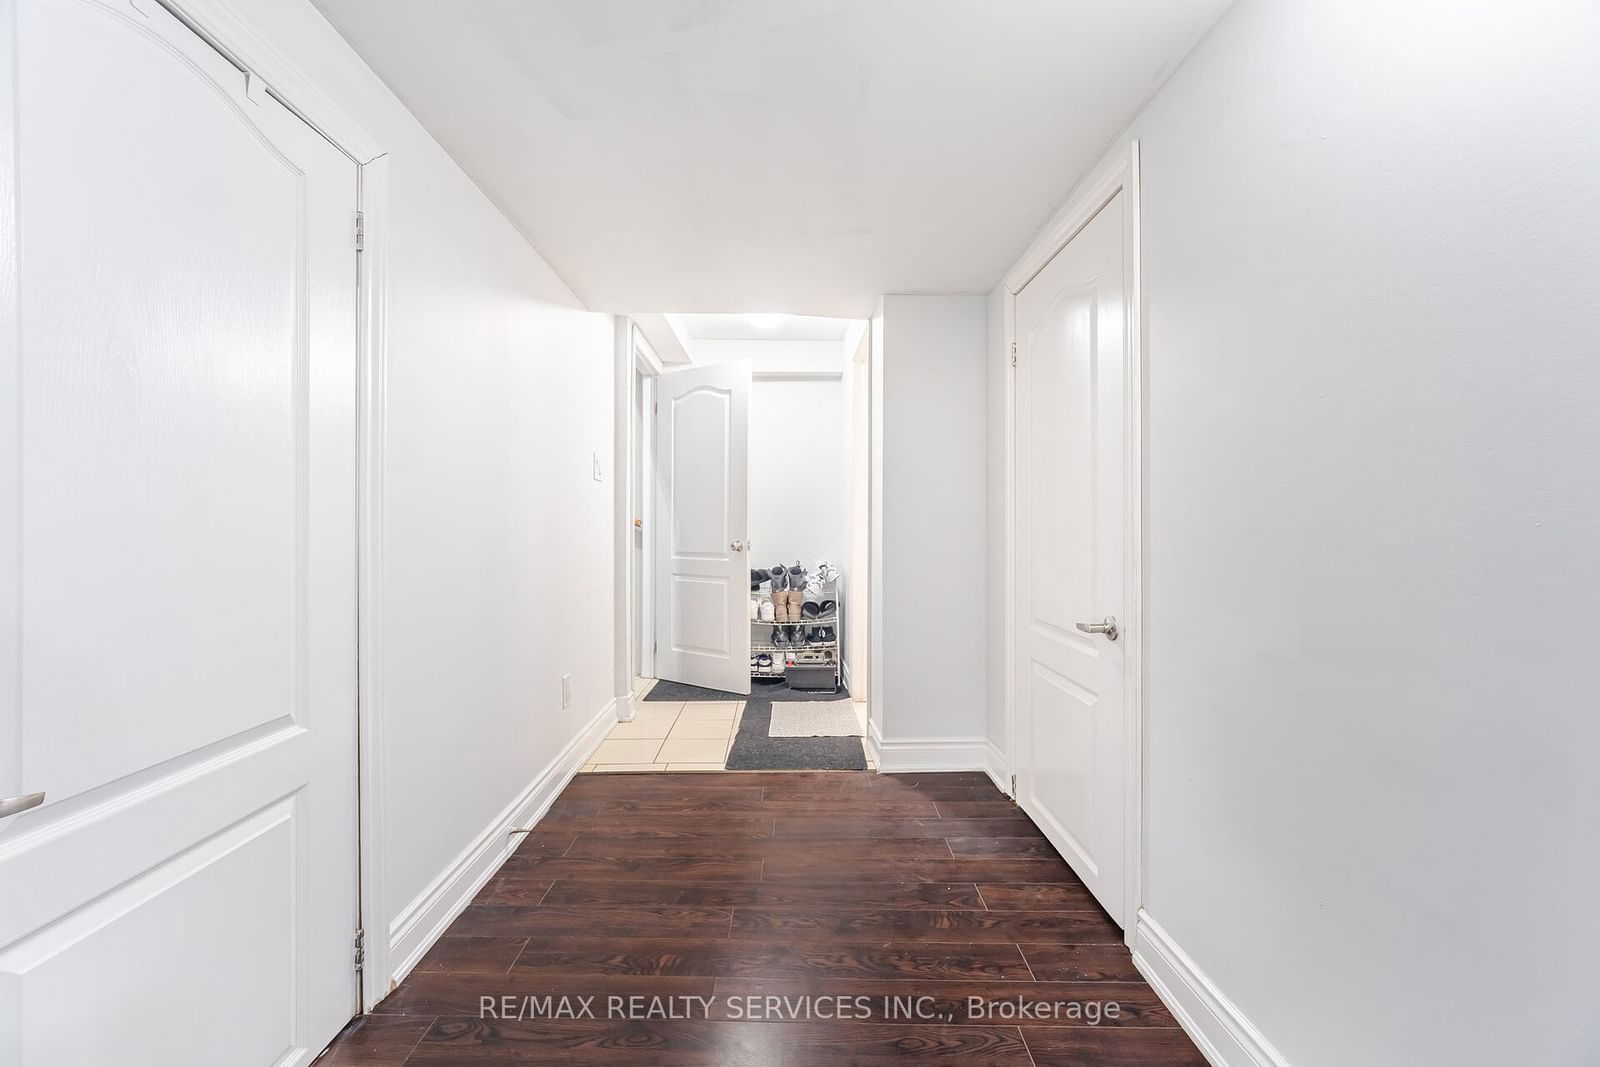
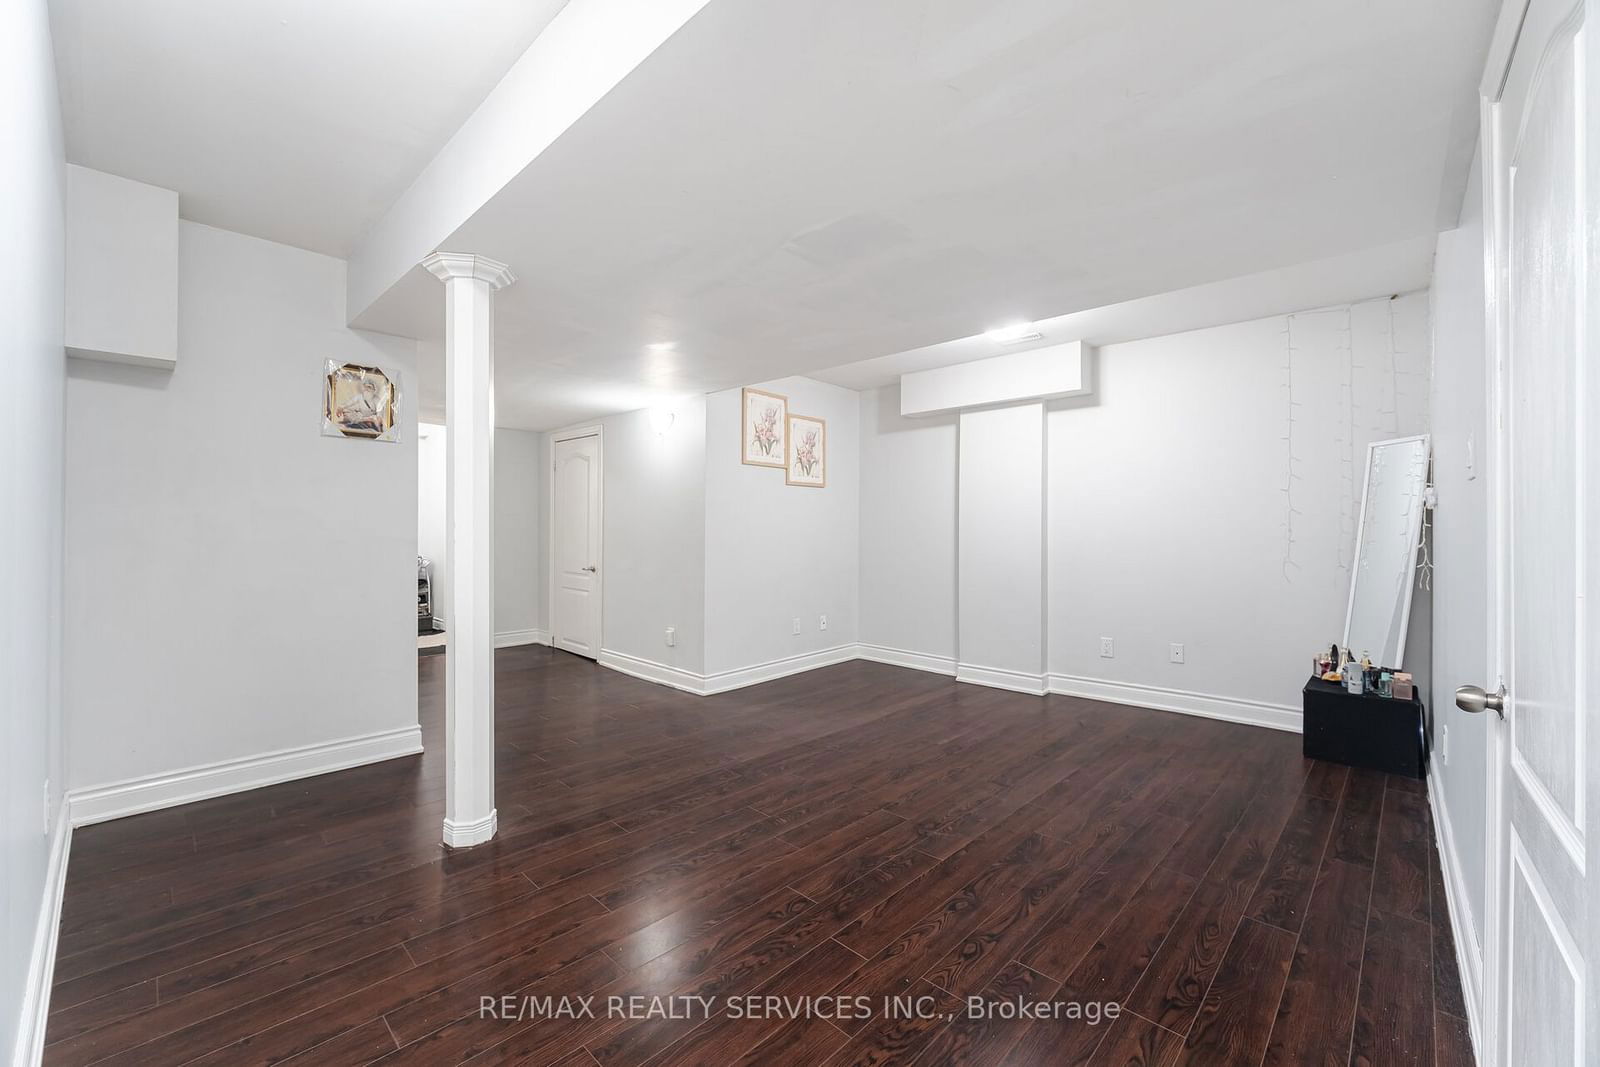
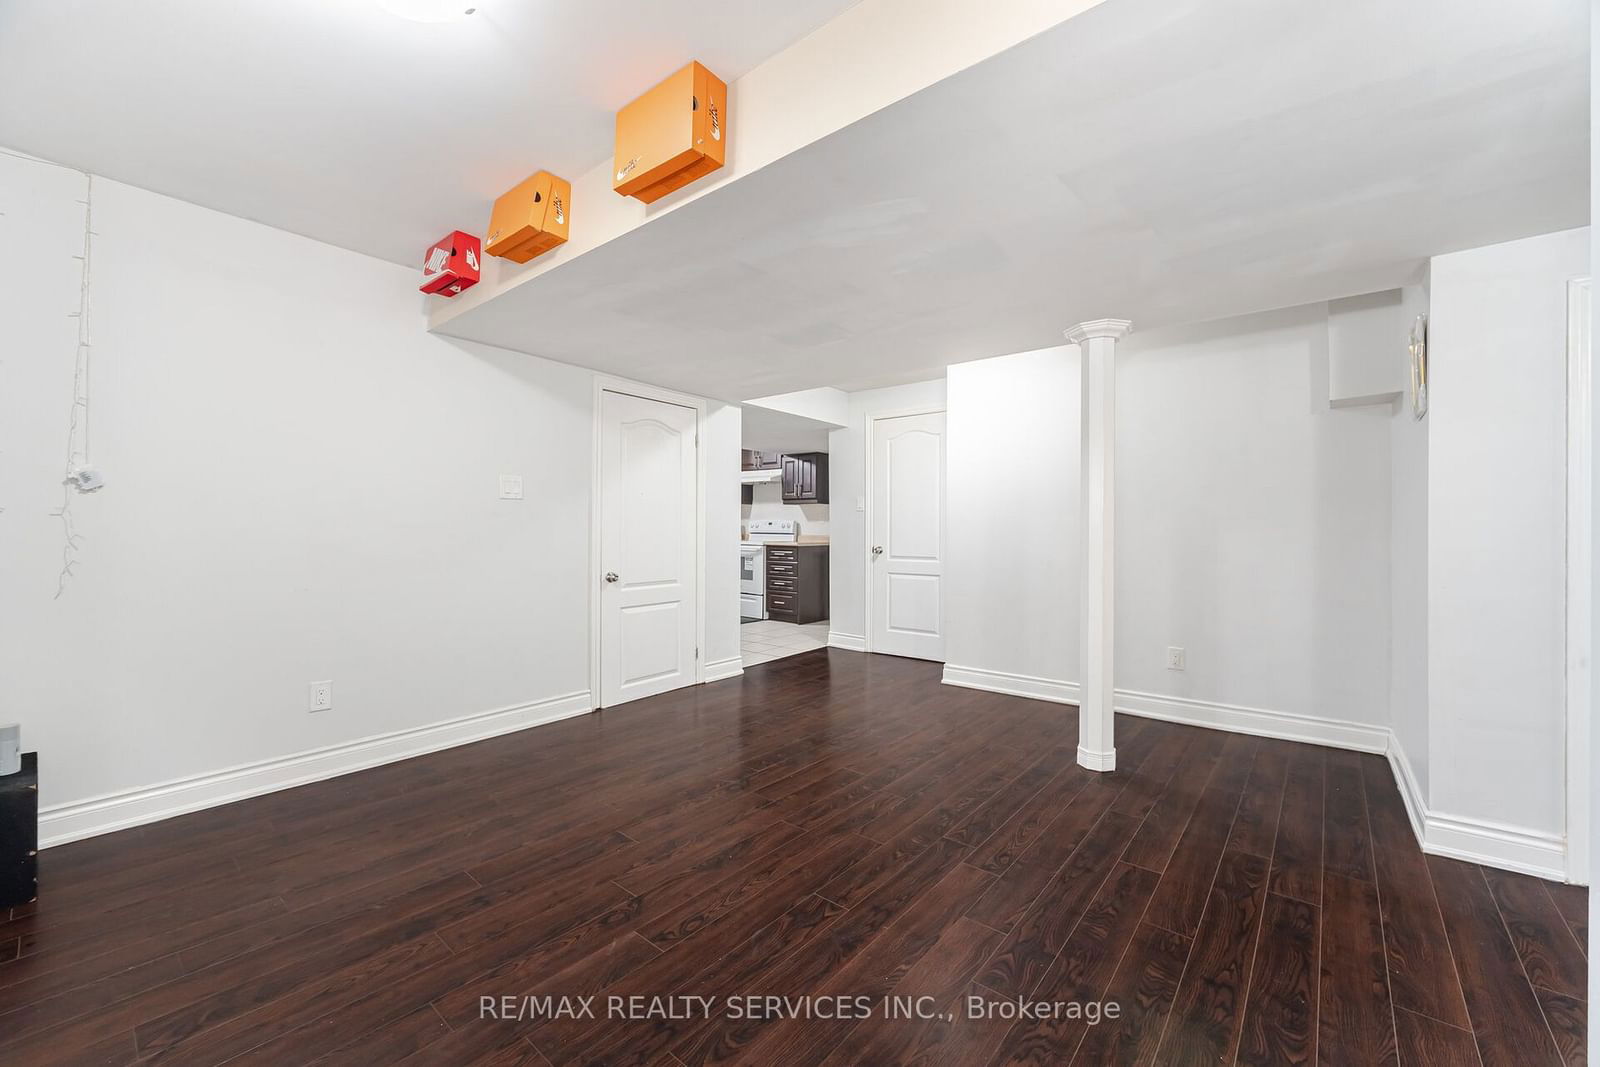
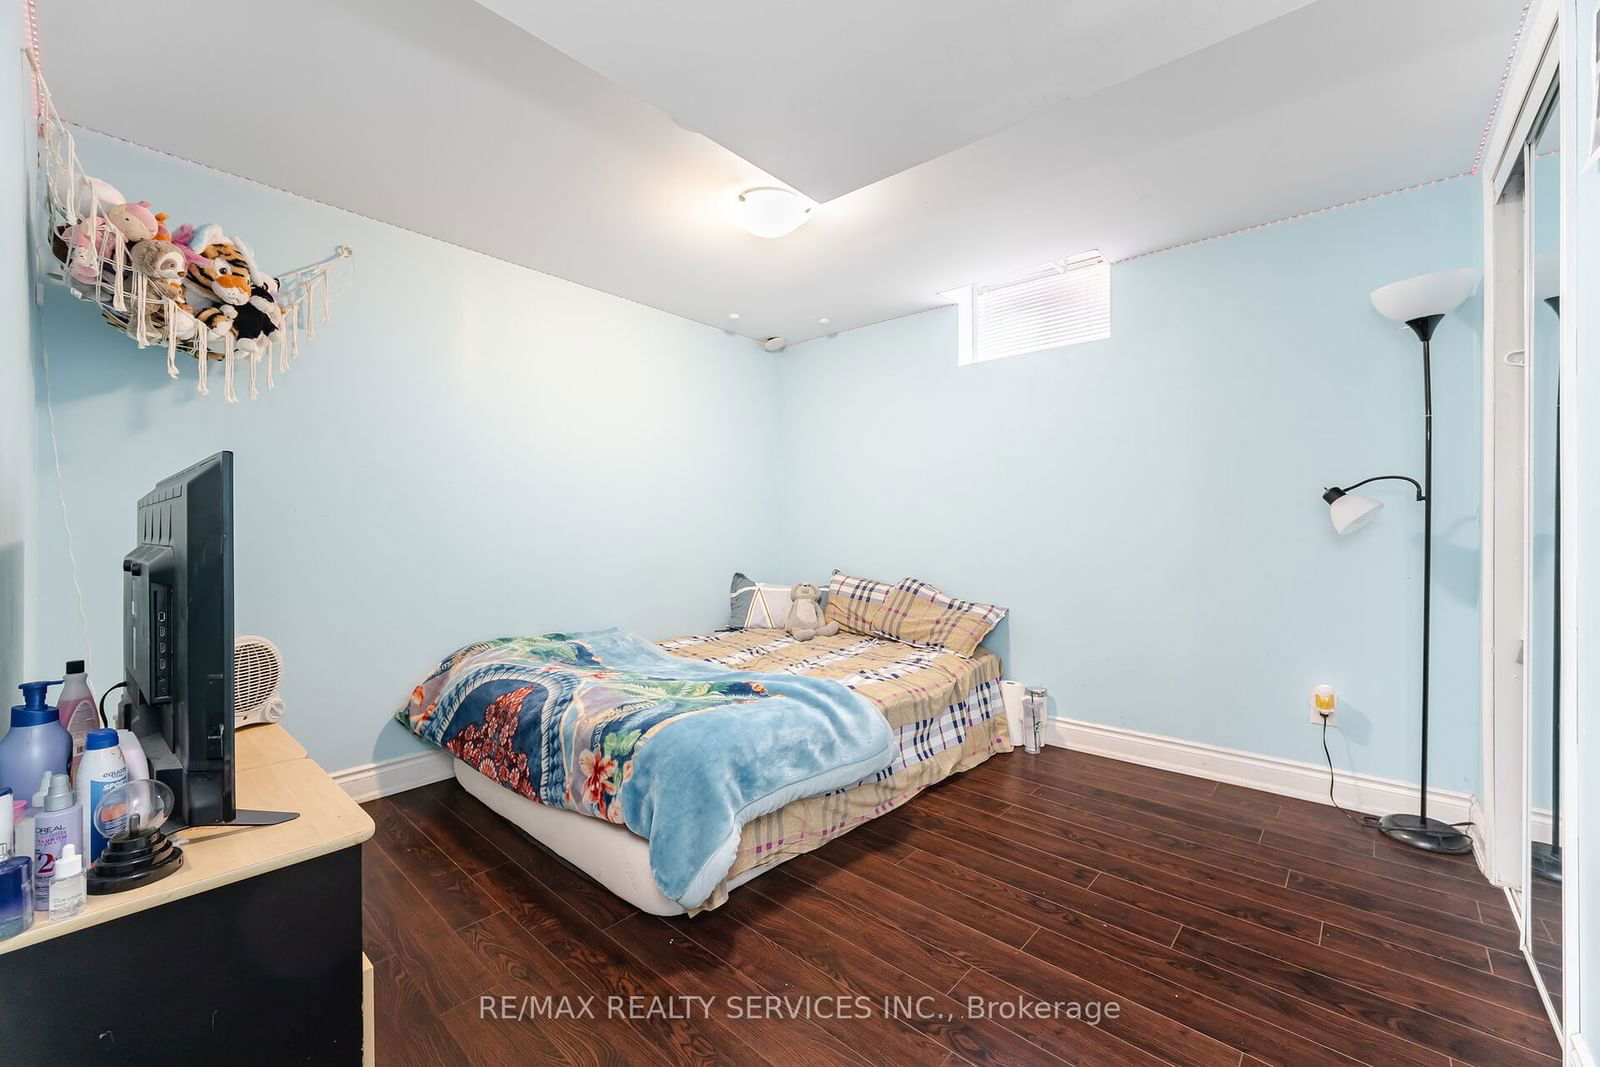
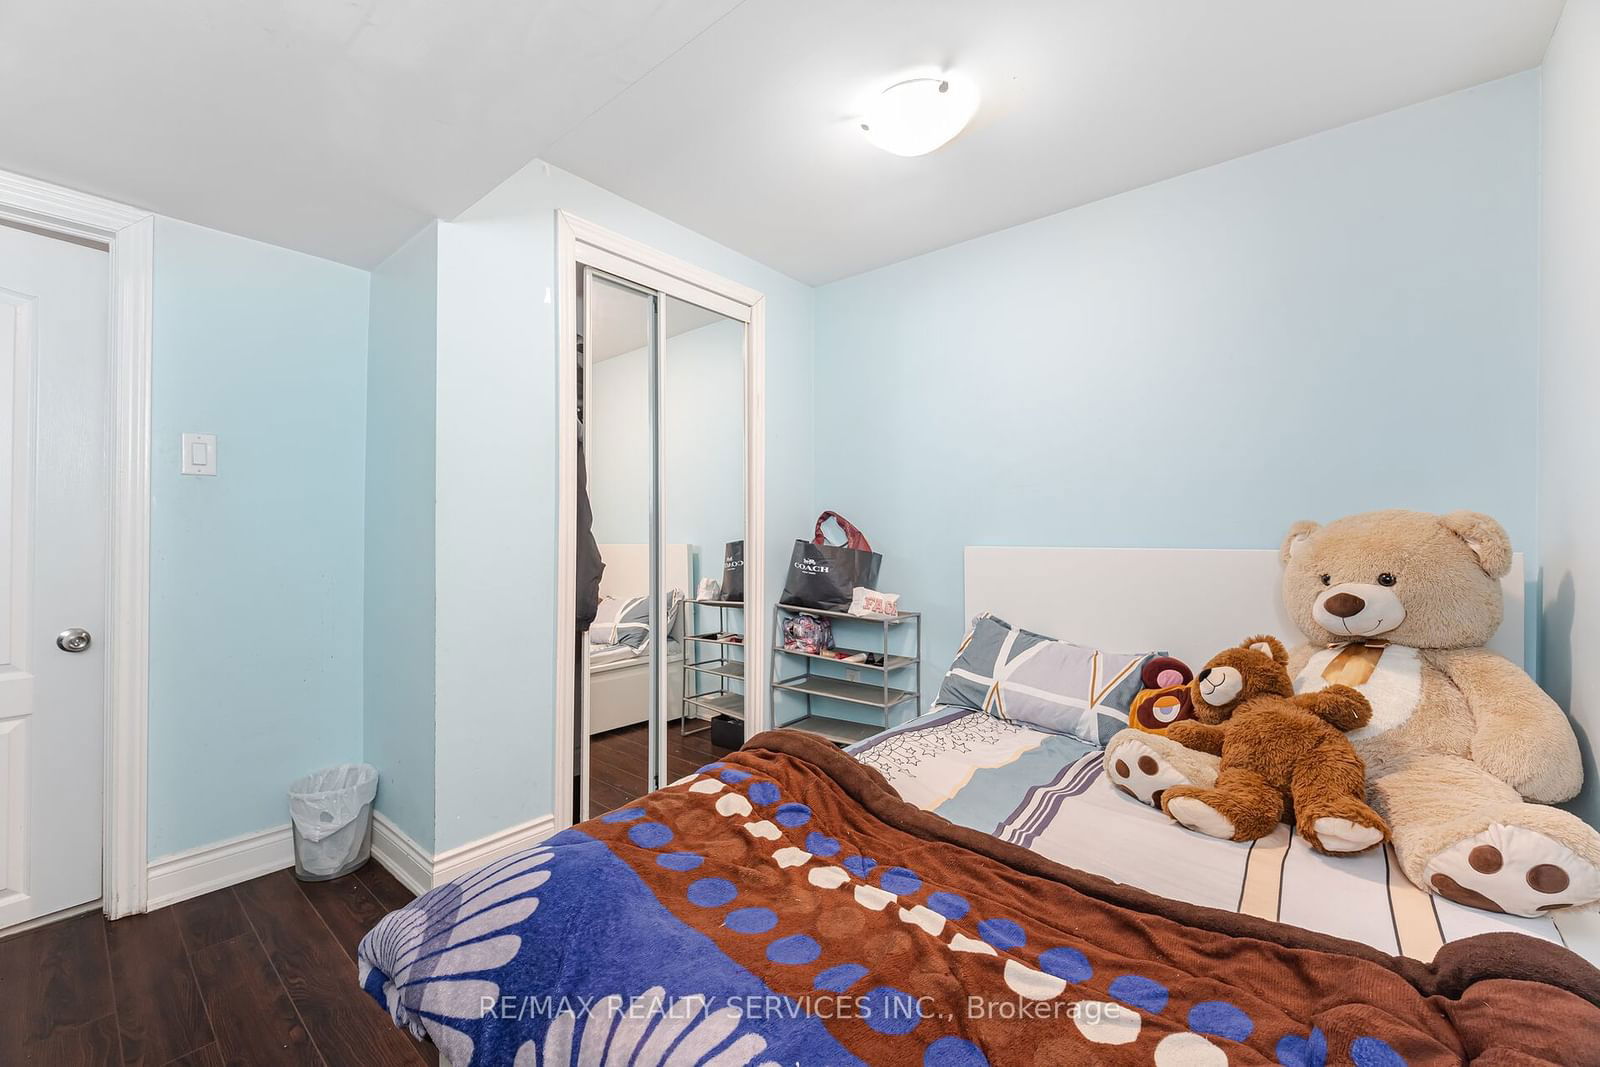
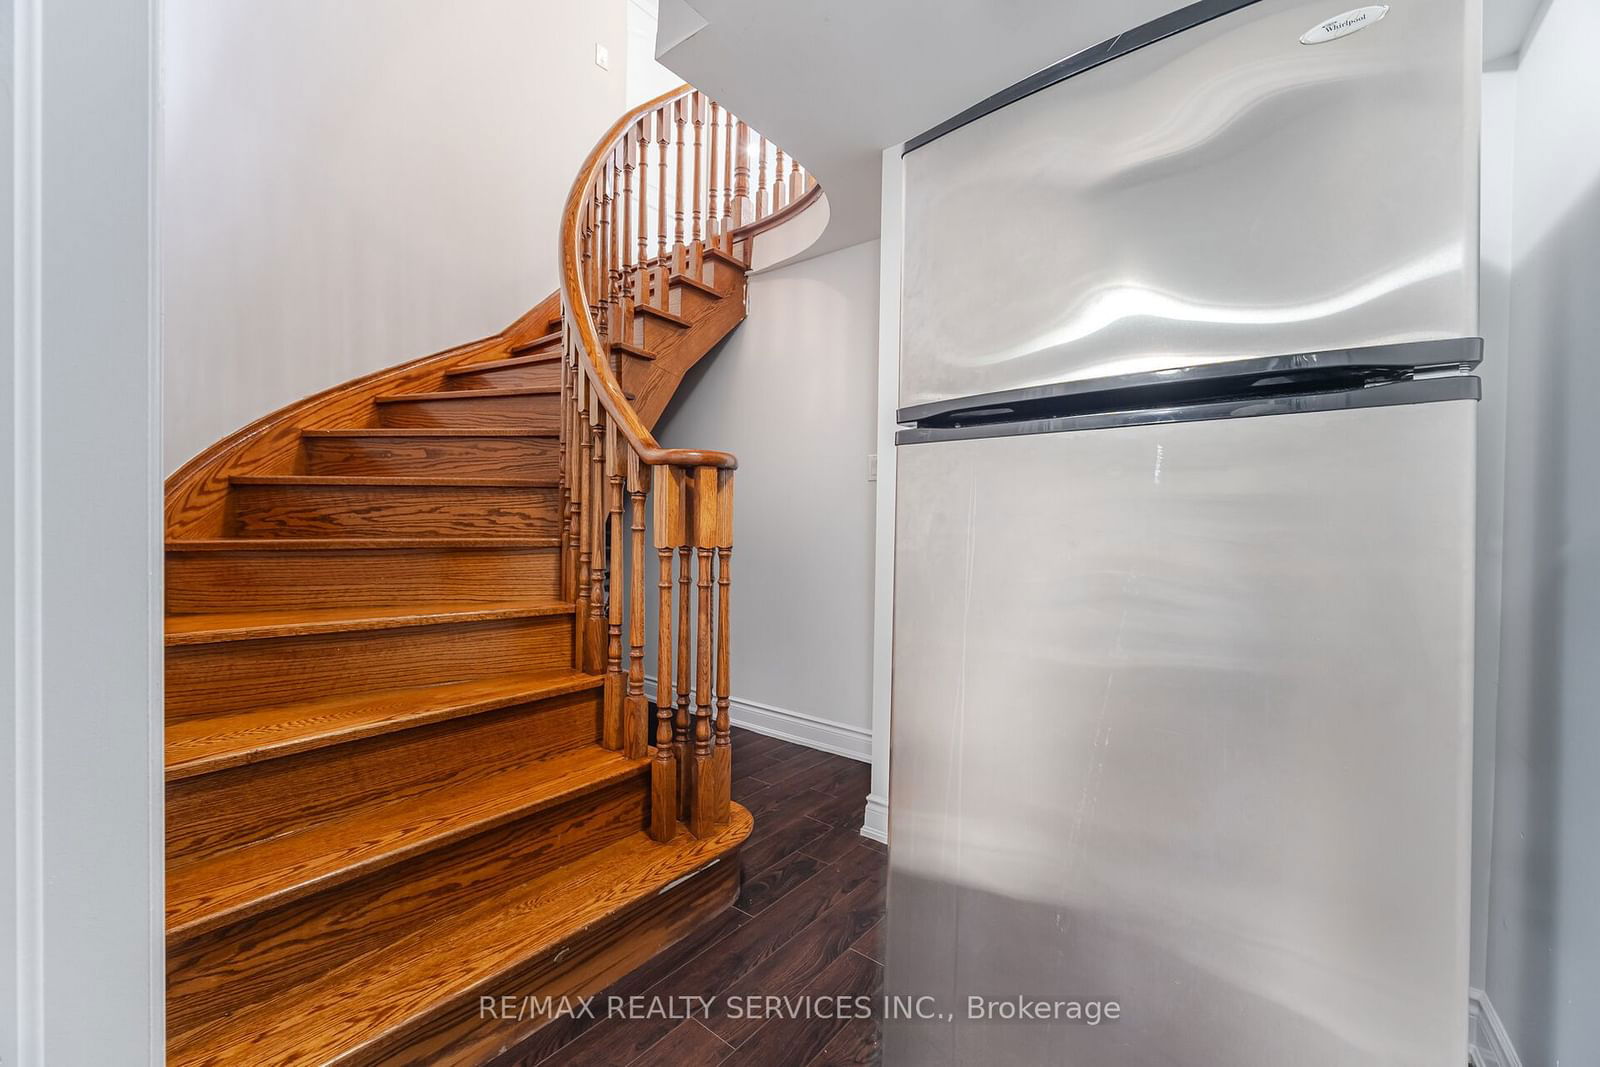
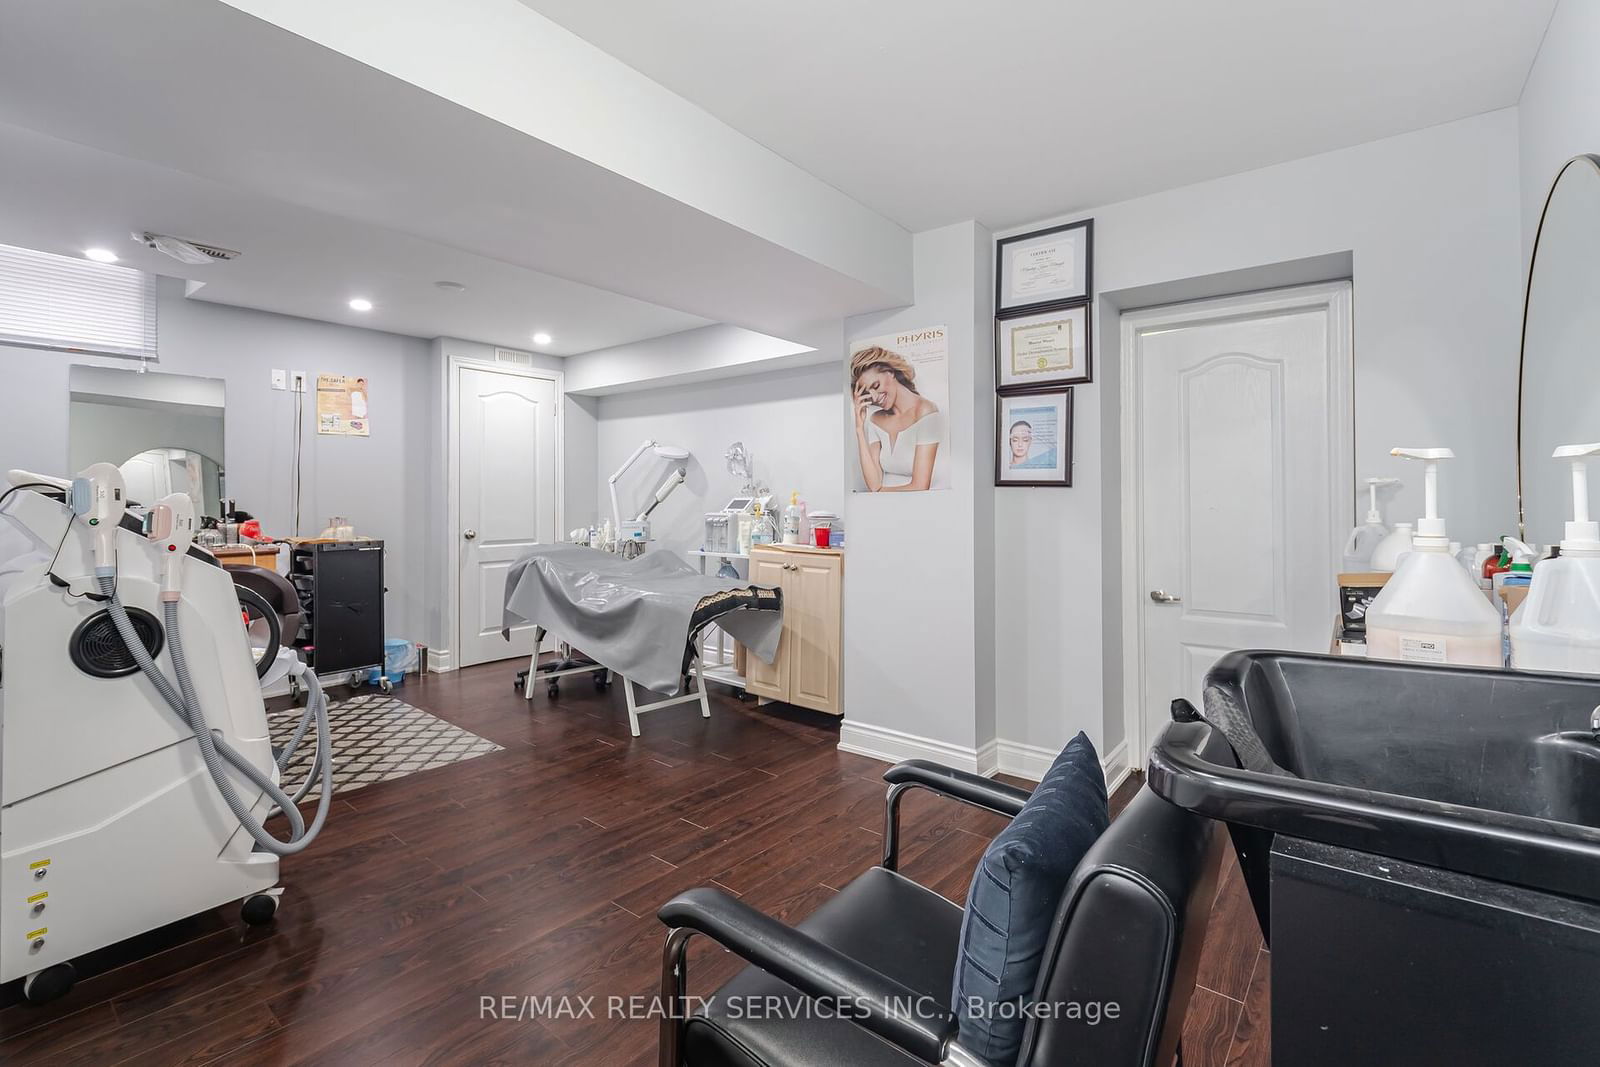
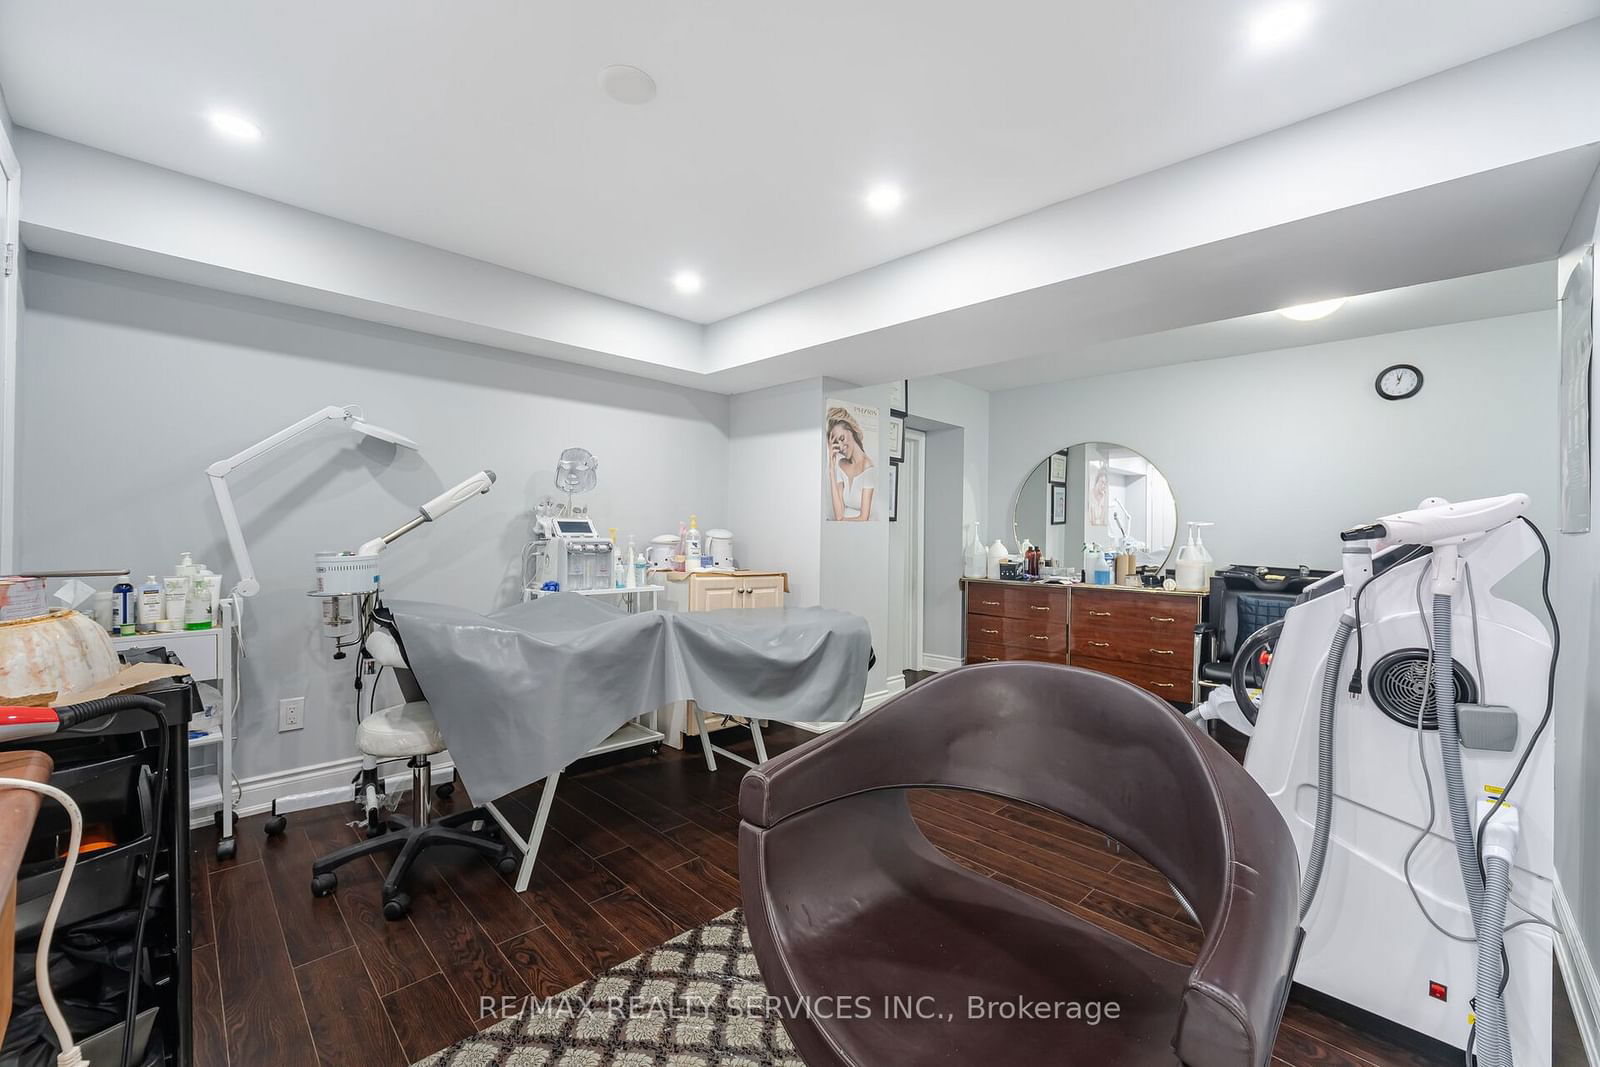
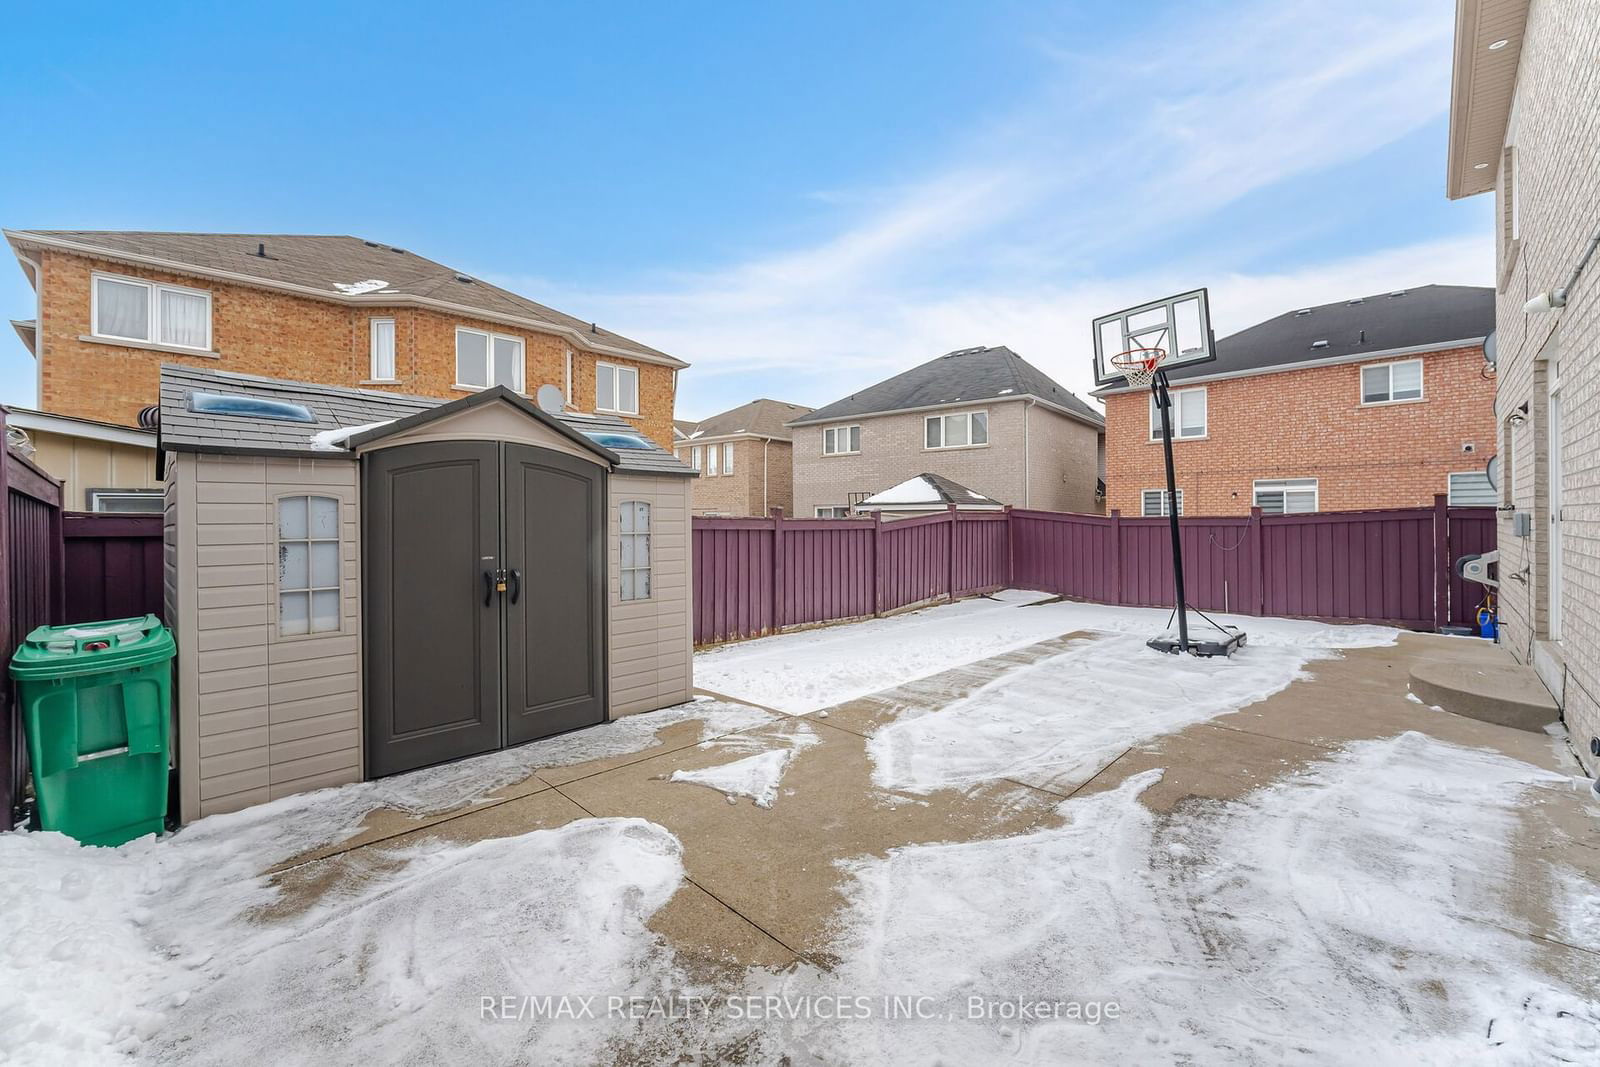
Welcome to this stunning upgraded 4+3 bedroom, 6-bathroom detached home spanning 2955 sqft (as per MPAC). This fully upgraded property boasts 9-foot ceilings on the main floor and elegant 24x24 modern ceramic tiles, exuding sophistication and style. This house features a separate Living/Family room. The family room with a cozy gas fireplace is the perfect centerpiece for relaxation and entertaining. The newly upgraded kitchen is a showstopper, featuring high-end stainless steel appliances, quartz countertops, and ample space for culinary creativity. Upstairs, you'll find four spacious, sunlit bedrooms, including a luxurious primary suite with a large walk-in closet and a spa-like 5-piece ensuite designed for ultimate comfort. All bedrooms feature attached bathrooms, ensuring convenience and privacy throughout. Other highlights include an oak staircase, pot lights, a sprinkler system in garden, shed in back for extra storage and meticulous upgrades. The modern 2-bedroom basement offers an excellent rental income opportunity, while an additional one-bedroom with a private 2-piece washroom is perfect for an in-law suite or extended family accommodations. Located near parks, upscale dining, and essential amenities, this home perfectly balances luxury, functionality, and timeless elegance. Don't miss this rare opportunity to elevate your lifestyle . **EXTRAS** All Elf's, Chandeliers on main and second floor, All modern and motorized curtains, Shed on the back, Pot Lights, Modern Crown molding, Security Cameras, Solar panels, Sprinkler system, Brand New Furnace, Closet organizers in all closets.
Living
Dining
Kitchen
Breakfast
Family
Br
2nd Br
3rd Br
4th Br
Br
2nd Br
3rd Br
The graph below compares the average list price and average sale price of homes in this neighborhood by month for the last 24 months. When average sale price is greater than average list price, this may suggest a buyer's market. When average sale price is lower than the average list price this may suggest a seller's market.
The graph below illustrates the average days on market for homes in this neighborhood. The yellow area may indicate a buyer's market, the green area may indicate a balanced market and the red area may indicate a seller's market.
Sales Representative, Century 21 People’s Choice Realty Inc., Brokerage
(647) 576 - 2100
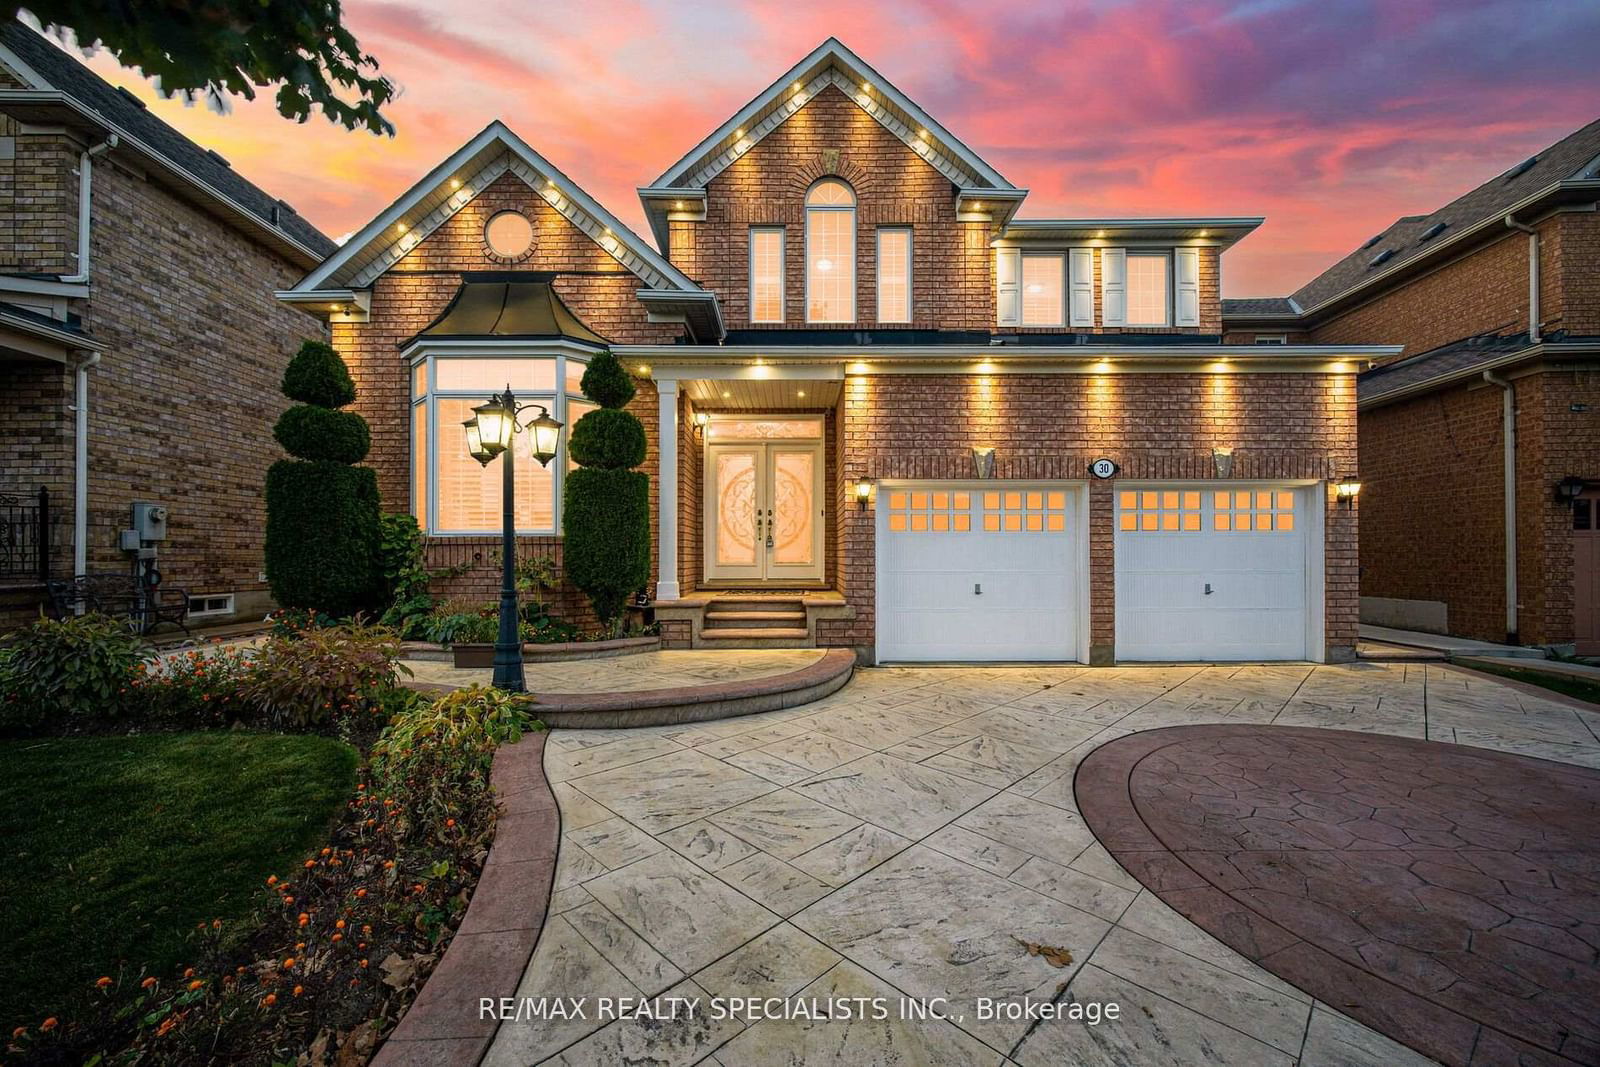
Brampton, Sandringham-Wellington North, L6R 0L4
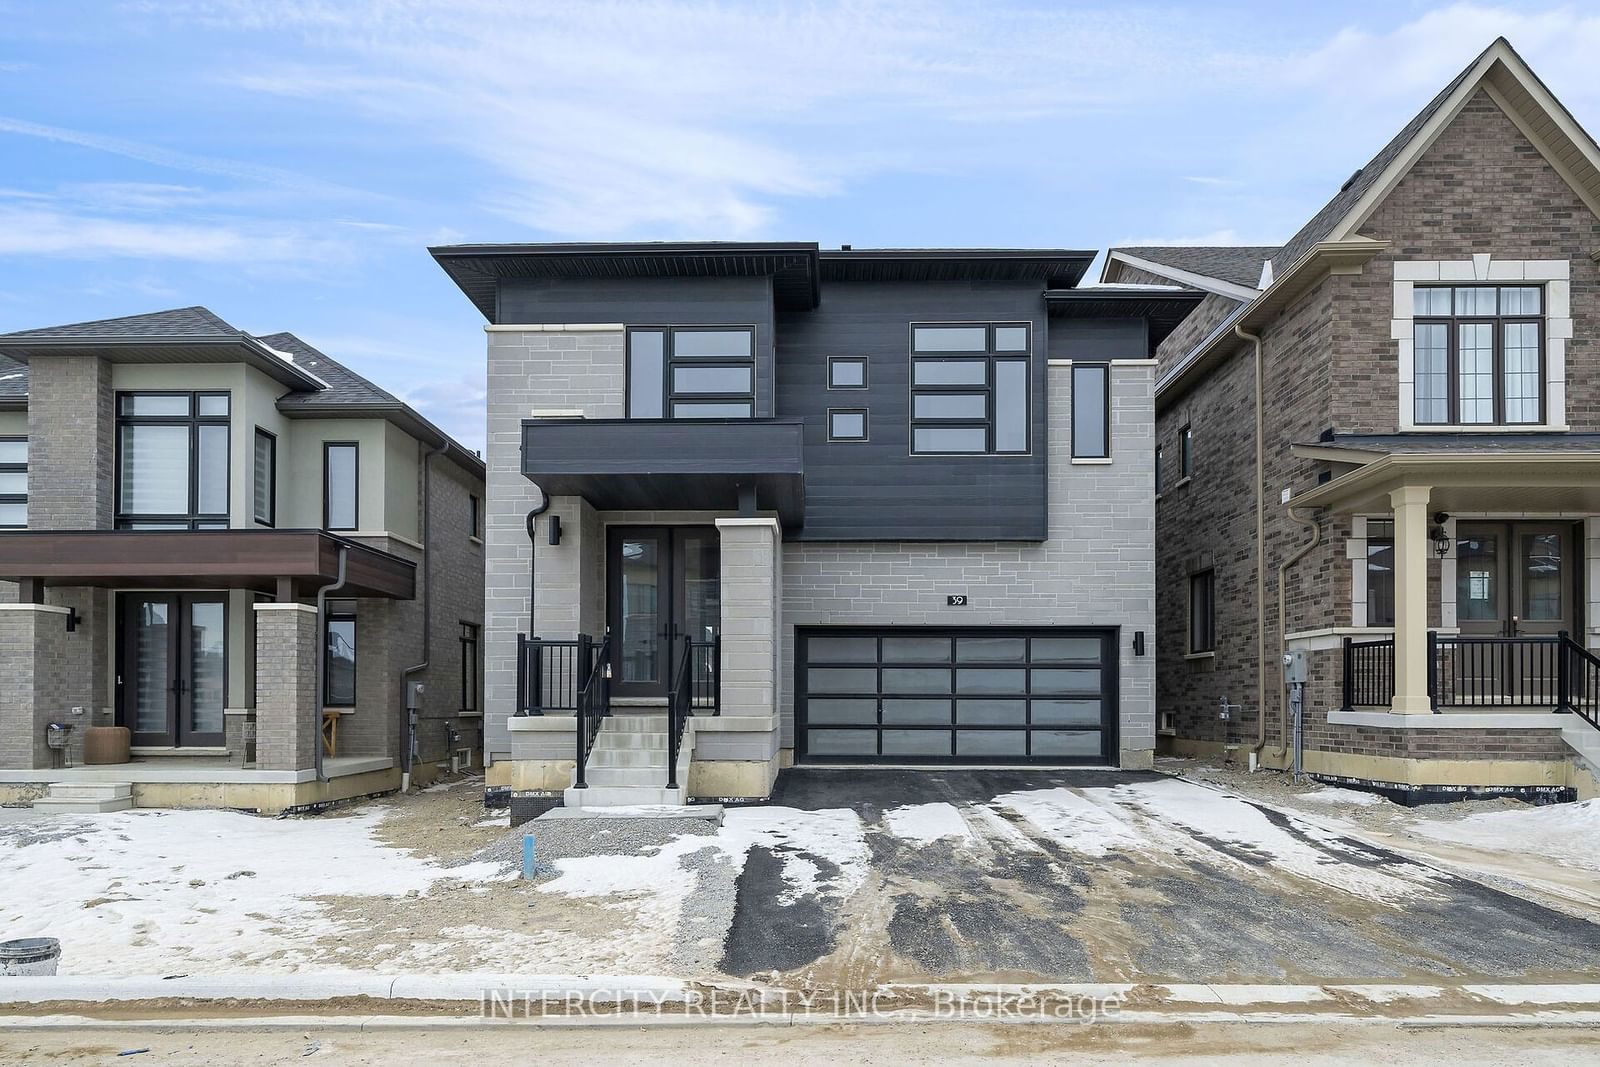
Brampton, Sandringham-Wellington, L6R 0H6
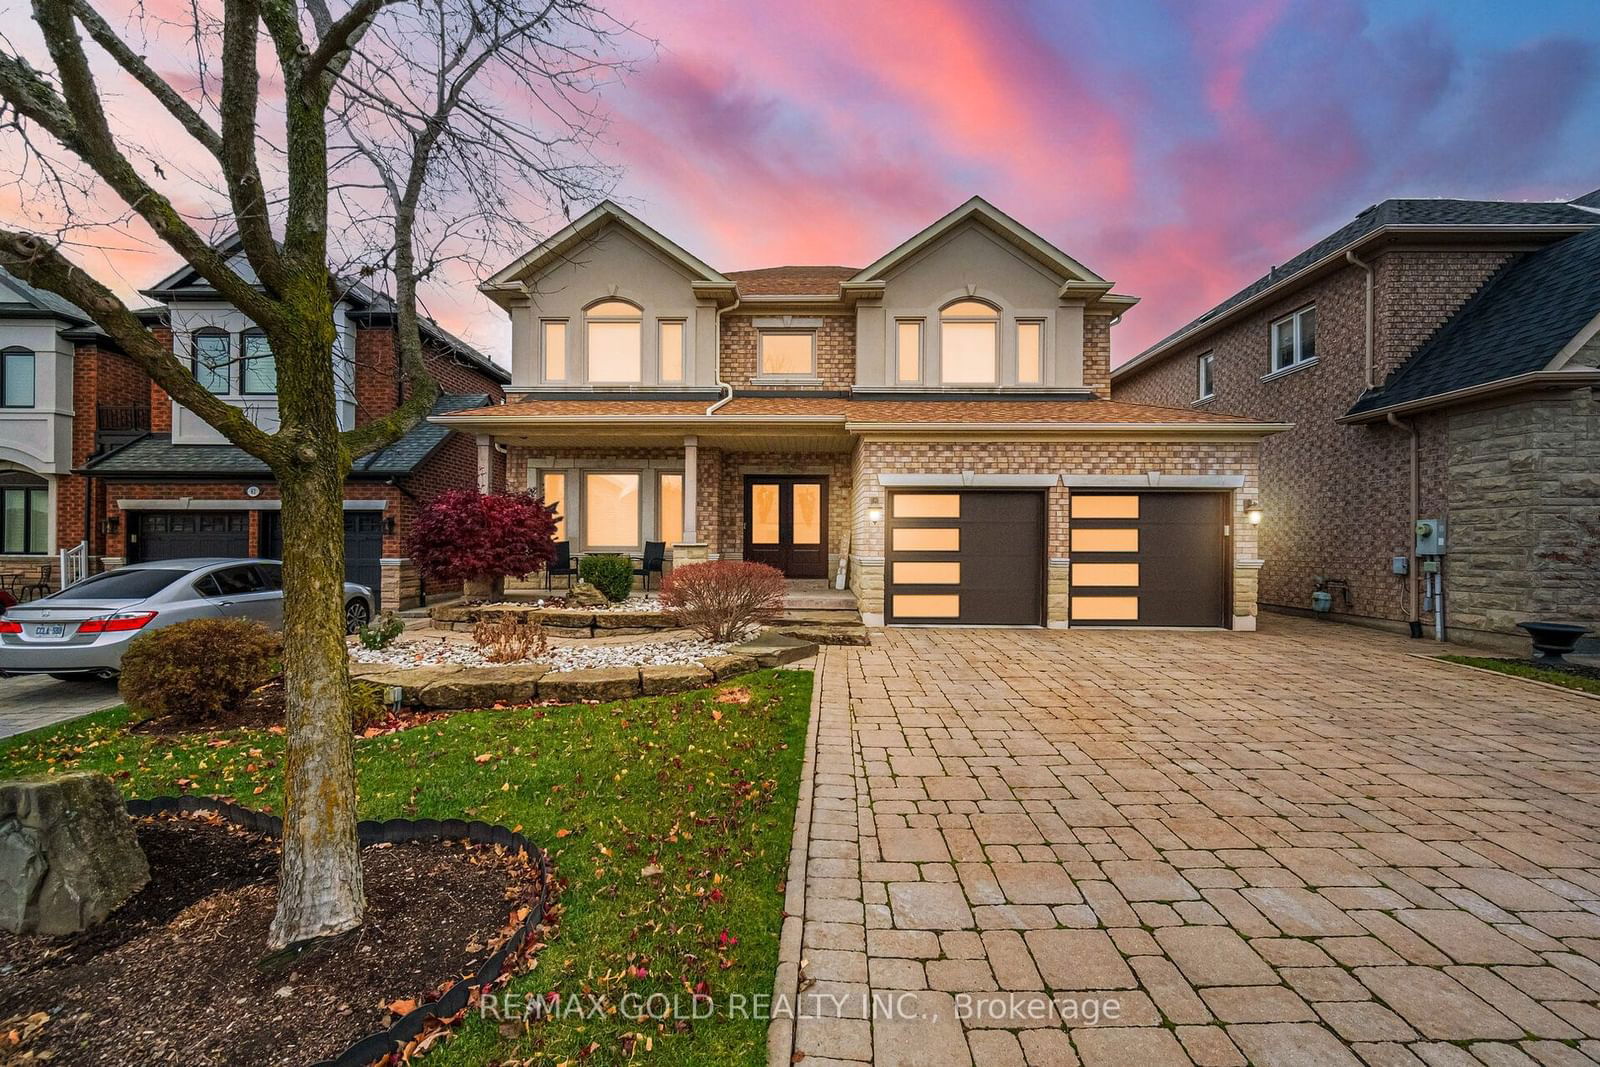
Brampton, Sandringham-Wellington, L6R 3E1
Brampton, Sandringham-Wellington, L6R 3G6
Brampton, Sandringham-Wellington North, L6R 4G2
Brampton, Vales of Castlemore, L6P 1X7
Brampton, Sandringham-Wellington, L6R 2Z5
Brampton, Sandringham-Wellington, L6R 4E8
Brampton, Vales of Castlemore North, L6P 1Y5
Brampton, Sandringham-Wellington North, L6R 4E8
Brampton, Sandringham-Wellington, L6R 4E9
Brampton, Vales of Castlemore North, L6P 1V6
Brampton, Sandringham-Wellington, L6R 0S4
Brampton, Sandringham-Wellington North, L6R 3V5